| Tweet | Follow @OphirGottlieb |  |  |

This visualization is provided by:
Make These Visualizations Yourself: Free Trial
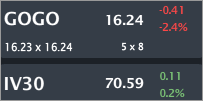
GOGO is trading $16.24, down 2.4% with IV30™ up 0.2%. The Symbol Summary is included below.
Provided by Livevol
Conclusion
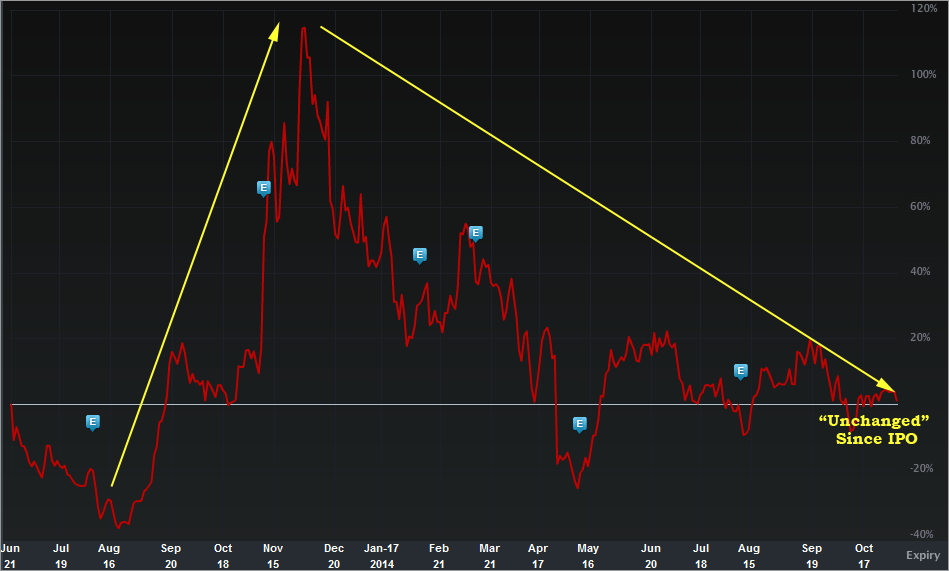
GOGO has earnings due out 11-10-2014, after the market closes. As of right now, with all the up swings and down swings in the equity price, the company is trading basically right at the IPO day close ($16.00).
The option market is pricing in less risk for this earnings cycle than any (ever) in the past and the equity market is pricing less forward looking upside than nearly any time in the past. This is an interesting coincidence of risk measures that actually... agree...
There are four metrics, ultimately, that may determine the stock reaction:
1. Sales and sales forecasts.
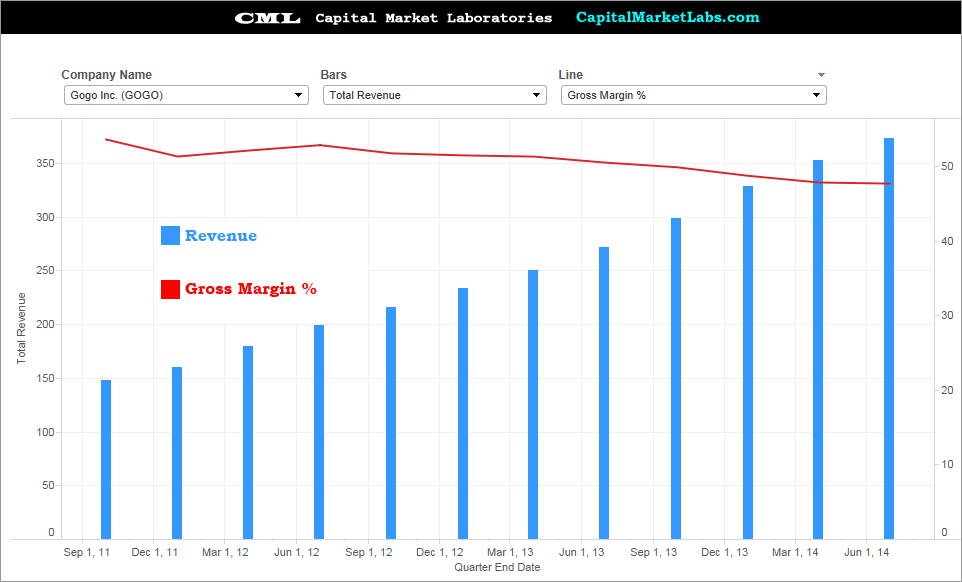
2. Gross Margin %: has been decreasing, it needs to stabilize. Anything over 50% would be good.
3. Operating Margins: If Operating Revenue / Operating Expense is > 1; good news.
4. If all three above are hits, then this will be too: Net Income.
Let's start with the stock return chart (all-time), below.
Provided by Livevol
We can see GOGO boomed up nearly 120% within months of IPO but has fallen from those highs to essentially unchanged from IPO day close. Interesting...
Now let's turn to the financial measures.
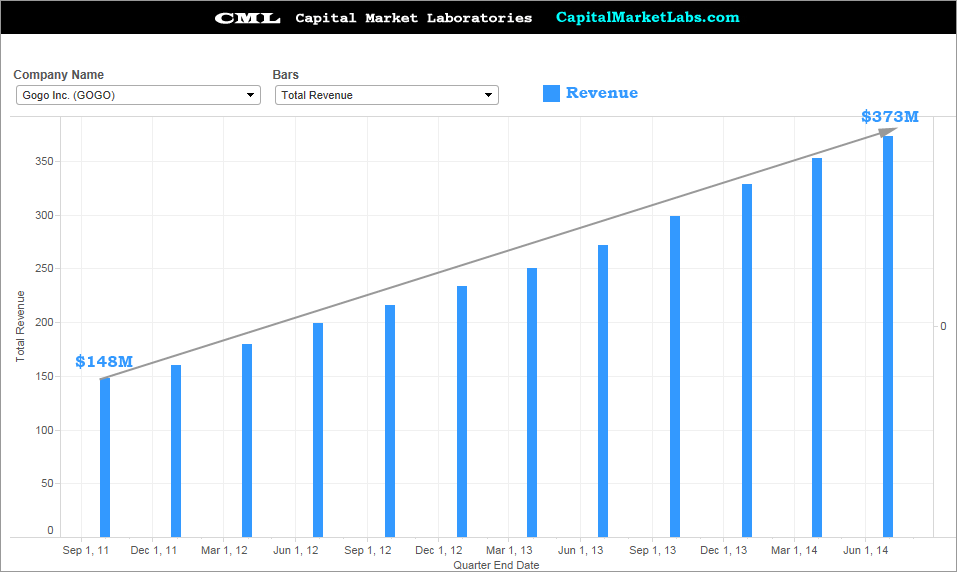
Total Revenue (TTM)
This is definitely "good" news for GOGO -- there is demand for their product(s) and revenue has more than doubled in three-years.
Provided by Capital Market Laboratories
Revenue (TTM) vs. Gross Margin %
When a young firm grows revenue quickly, the next step I always take is to measure gross margin % trend. We can see that the gross margin % for GOGO has fallen since it went public. This isn't a "huge revelation," but it certainly isn't "steady" yet. Keep an eye on this number when earnings come out -- it's hugely important.
Provided by Capital Market Laboratories
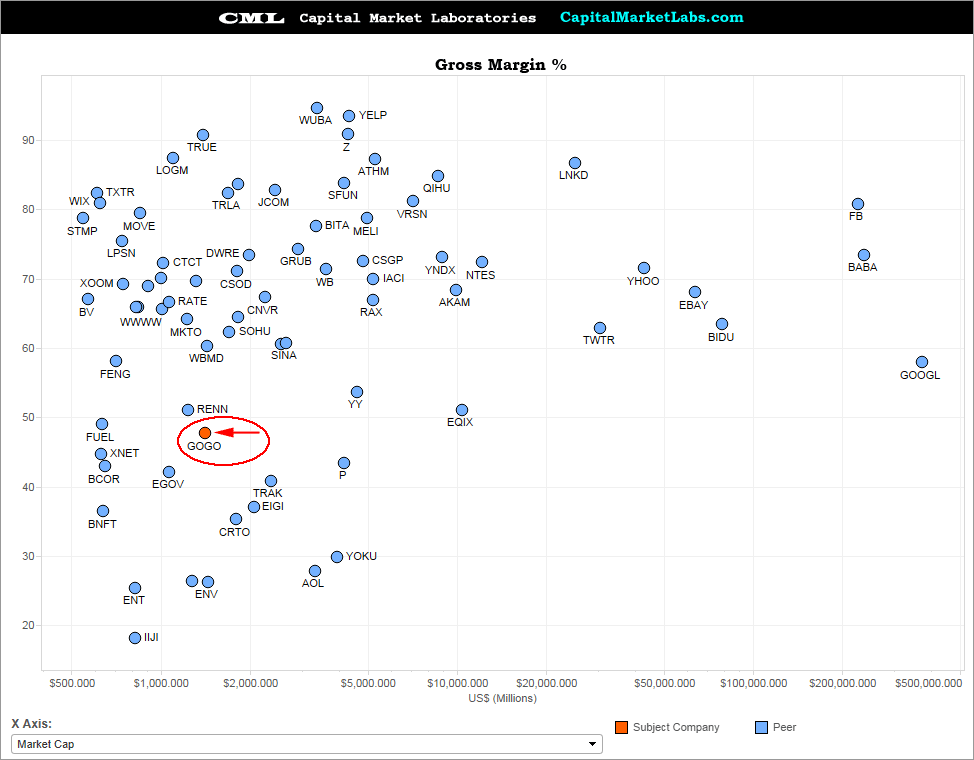
Gross Margin % vs. Peers
For sake of a broader picture, I have plotted GOGO's gross margin% vs its peers. We can see GOGO in the bottom third -- it's hard to call 47% gross margin % "bad," but for Internet Services & Software, it sure ain't great.
Provided by Capital Market Laboratories
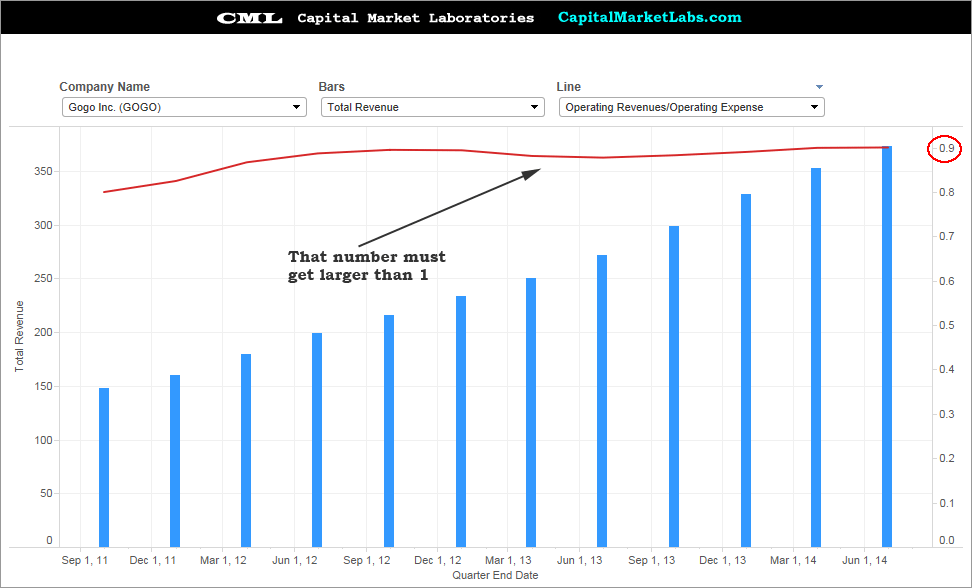
Revenue vs. Operating Margin % (TTM)
This is one of my favorite measures of all: Operating Revenue / Operating Expense. In English, it measures how much revenue is generated for every $1 of expense. Obviously, this number must be greater than 1 for a firm to be profitable.
The good news for GOGO is that there is consistency even as revenues grow. The bad news is, the number seems to be hitting a sort of equilibrium and an equilibrium at 0.9 just won't cut it -- ever. This number is even bigger (importance) for GOGO in the upcoming earnings release.
Provided by Capital Market Laboratories
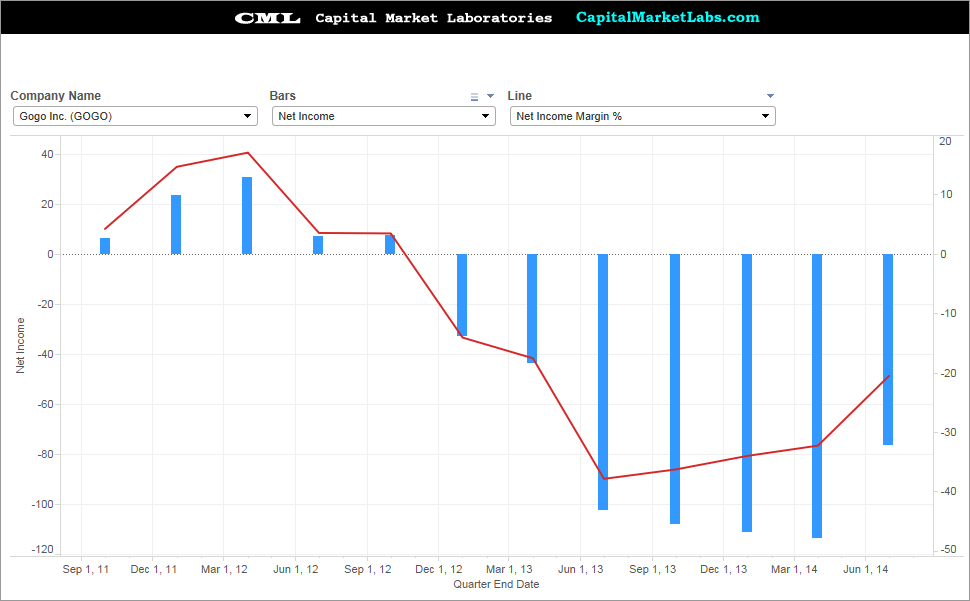
Net Income (TTM) vs. Net Income Margin %
Ultimately it comes down to earnings, and we know GOGO is in loss territory simply because the prior measure is less than 1. We do see a nice uptrend in net income (and the margin). The question is, will GOGO turn it positive, and then turn it, "a lot positive?"
Provided by Capital Market Laboratories
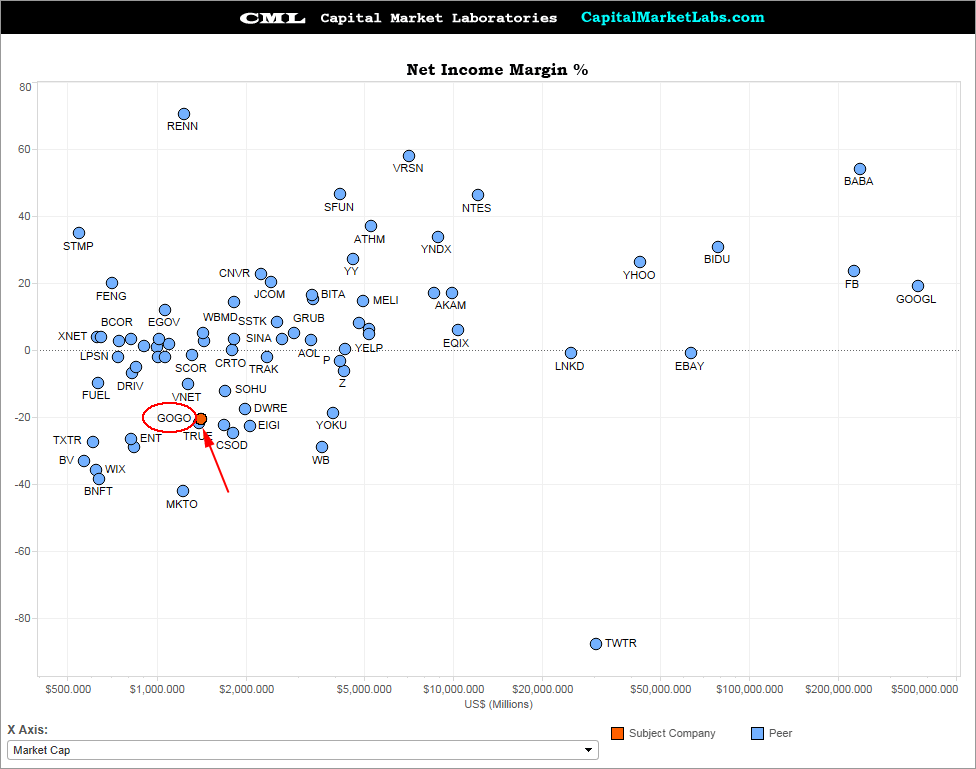
Net Income Margin %
Again, for a broader perspective, here is how GOGO's net income margin % looks relative to peers. Since it's losing money (currently), this sin;t going to look good for the moment.
Provided by Capital Market Laboratories
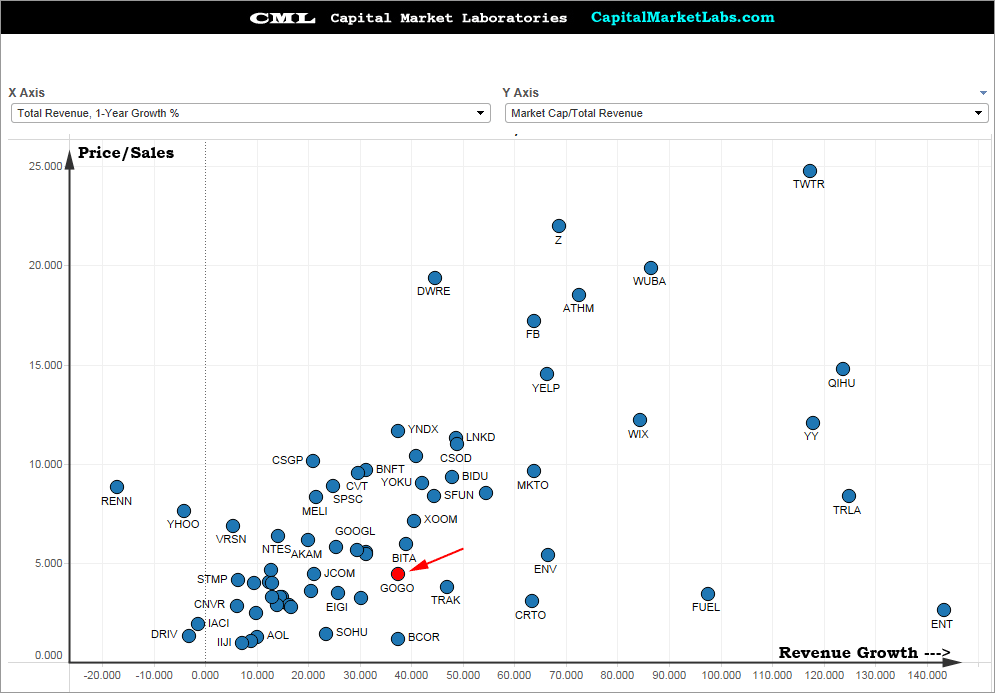
Revenue, 1-Year Growth vs. Price to Sales
We have revenue growth on the x-axis and price to sales on the y-axis. This actually isn't such bad news for GOGO. The firm's revenue growth is solid, regardless of peers, and the fact that the price to sales is low"ish," actually reflects less risk in the stock price and less "perfection" priced into the stock.
Provided by Capital Market Laboratories
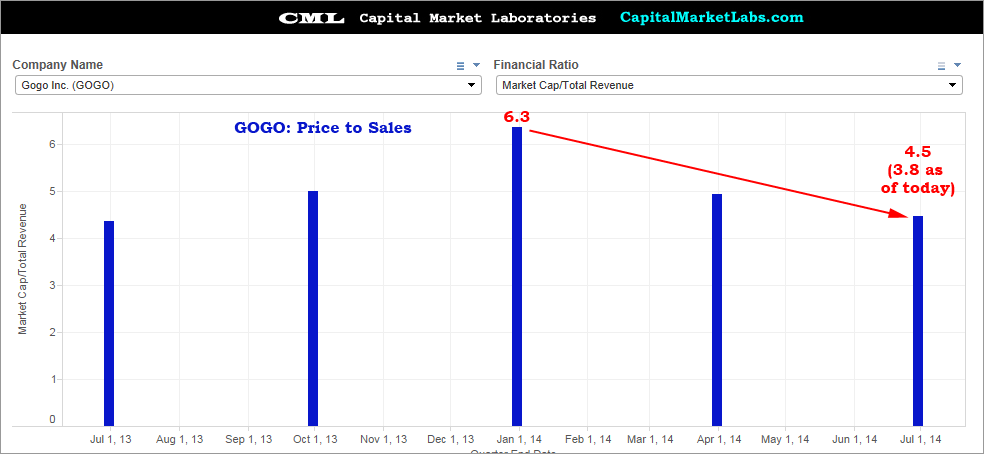
Price to Sales Trend
We can see GOGO's price to sales started losing its mind as the stock price rose, but it has cooled off, and actually sits at 3.8 as of this writing (4.5 as of the last financial filing). 3.8 isn't low, but, as we saw in the chart above, relative to this industry, it's really not too crazy...
Provided by Capital Market Laboratories
OK, let's turn to risk pricing and the IV30™ chart in isolation, below.

Provided by Livevol
The implied volatility is the forward looking risk in the equity price as reflected by the option market (IV30™ looks forward exactly 30 calendar days).
In English, the red curve is the risk in future stock price movement. the blue "E" icons represent prior earnings releases and we can see that for this earnings report, GOGO is showing substantially lower risk than any other cycle via the option market. What's interesting here, unlike with SSYS and NFLX, the equity market is also showing less risk via the price to sales ratio.
So, while I was jumping up and down abut NFLX and SSYS (both of which moved violently more than the option market priced), this time, I'm not jumping anywhere. The vol seems low, but, perfection is not priced into this stock.
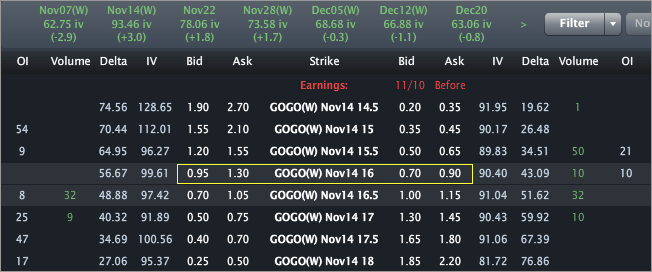
Finally, the Options Tab is included below.
Provided by Livevol
Using the at-the-money (ATM) straddle we can see that the option market reflects a price range of [$13.90, $18.10] by the end of trading on Nov. 14th.
- If you believe the stock will be outside that range on expiry or any date before then, then you think the volatility is too low.
- If you believe that range is too wide, and that the stock will definitively be in that range on expiration, then you think volatility is too high.
- If you're not sure, and can make an argument for either case, then you think volatility is priced just about right.
This is trade analysis, not a recommendation.
Follow @OphirGottlieb
Tweet
Legal Stuff:
Options involve risk. Prior to buying or selling an option, an investor must receive a copy of Characteristics and Risks of Standardized Options. Investors need a broker to trade options, and must meet suitability requirements.
The information contained on this site is provided for general informational purposes, as a convenience to the readers. The materials are not a substitute for obtaining professional advice from a qualified person, firm or corporation. Consult the appropriate professional advisor for more complete and current information. I am not engaged in rendering any legal or professional services by placing these general informational materials on this website.
I specifically disclaim any liability, whether based in contract, tort, strict liability or otherwise, for any direct, indirect, incidental, consequential, or special damages arising out of or in any way connected with access to or use of the site, even if I have been advised of the possibility of such damages, including liability in connection with mistakes or omissions in, or delays in transmission of, information to or from the user, interruptions in telecommunications connections to the site or viruses.
I make no representations or warranties about the accuracy or completeness of the information contained on this website. Any links provided to other server sites are offered as a matter of convenience and in no way are meant to imply that I endorse, sponsor, promote or am affiliated with the owners of or participants in those sites, or endorse any information contained on those sites, unless expressly stated.


No comments:
Post a Comment