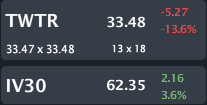
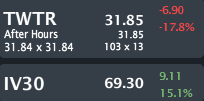
TWTR is trading $33.48, down 13.6% with IV30™ up 3.6%. The Symbol Summary is included below.
Provided by Livevol
UPDATE: Close at end of day
Provided by Livevol
News Today:
----
TWITTER TUMBLE: The instant messaging service plunged $4.75, or 12.3 percent, to $34 after Twitter insiders were allowed to sell stock for the first time since the company's initial public offering in November. The company said last month that some key insiders, such as CEO Dick Costolo, did not plan to sell stock when the lock-up period expired. Twitter has lost more than half its value since going as high as $74.73 in December.
Source: AP
-----
This is a follow up to two articles. First, from Dec. 26th:
TWTR - UPDATE: How the Option Market Totally Blew It, And We Knew it Two-Weeks Ago.
More on that one later in this article, but it was a ridiculous mispricing of risk in TWTR that I was jumping up and down about.
The more recent article I posted was right after the earnings release which summarized the results of that news. The link is below followed by a quick summary.
---------------------
TWTR - Earnings Postmortem; Just The Facts: Everything You Need to Know
- Average Active Users: 255M up 5.8% quarter-over-quarter and 25% Y-O-Y
- "Freshened" Timelines: 157 billion times up 15% from last year but below analyst estimates
- Revenue: $250M (up 119% from $114M a year ago) above estimates of $241.5M
- Ad Revenue per Thousand Timeline Views: $1.44 (nearly 2x last quarter).
- Ad Revenue: $226M up 125% from year ago
- Mobile Ad Revenue: 80% of total revenue
- Mobile Ad Market Share: Estimate 2.7% (up from 2.4%) vs FB 22% and GOOG 47%
- "Excluding Items" EPS: Even vs. expected -0.03 (loss)
- Net Loss: $135MM (up 5x from $27M a year ago)
Future:
Revenue Next Quarter: Company forecasts $272M; Wall St. estimates were [$270M, $280M]
Revenue for Full Year: Wall St. Estimates: $1.2B - $1.25B
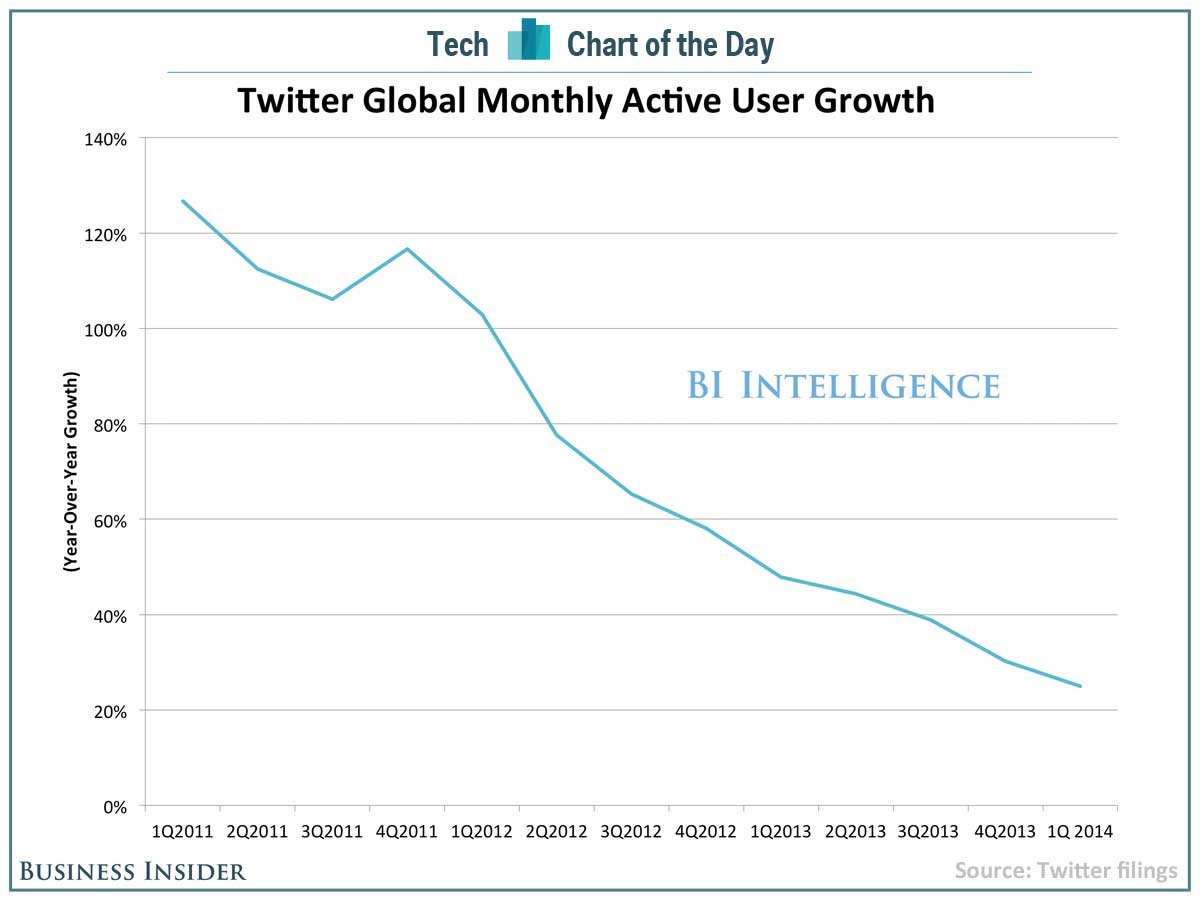
But, the chart of the day comes from BUSINESS INSIDER:
Provided by BUSINESS INSIDER
Yep... Active user growth is down to 5.8% quarter over quarter, down from over 120%. Can you imagine if that turns negative?... yikes.
---------------------
It's that top chart that's frightening. It's a quarter away (maybe) from showing negative growth (aka shrinkage).
Many people felt that after the earnings release, the TWTR stock action sort of created anew support level in the $37 range. But that's not the case (for at lest half a trading day). TWTR is a growth story, and that chart / data is absolutely terrible. It doesn't mean it won't turn around -- there are a lot of smart people trying to turn it around, but until then, TWTR has no 'bottom.'
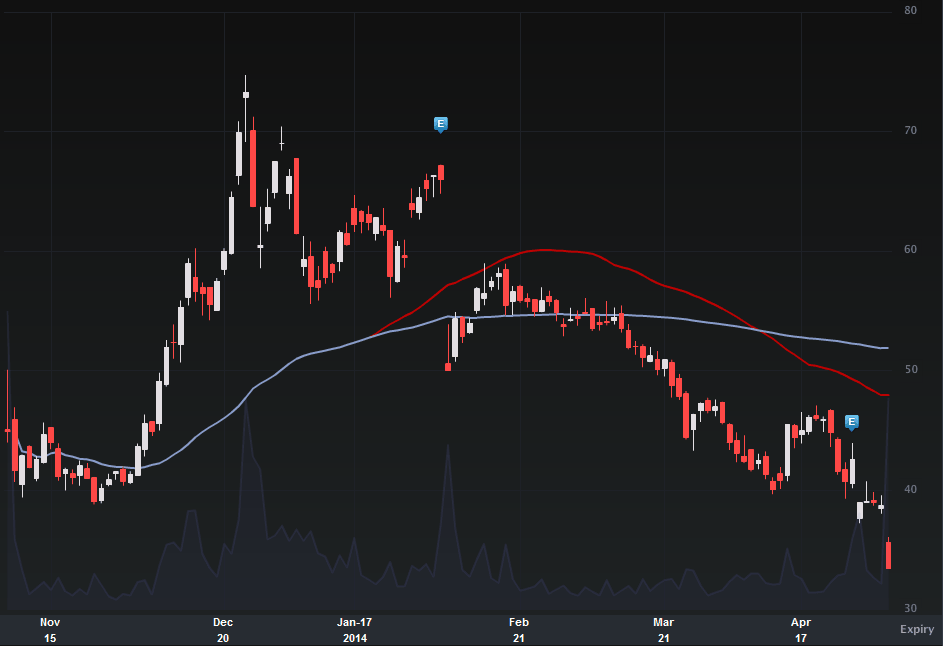
Let's turn tot eh volatility, which is where I see a bigger story. The Charts Tab is below.
Provided by Livevol
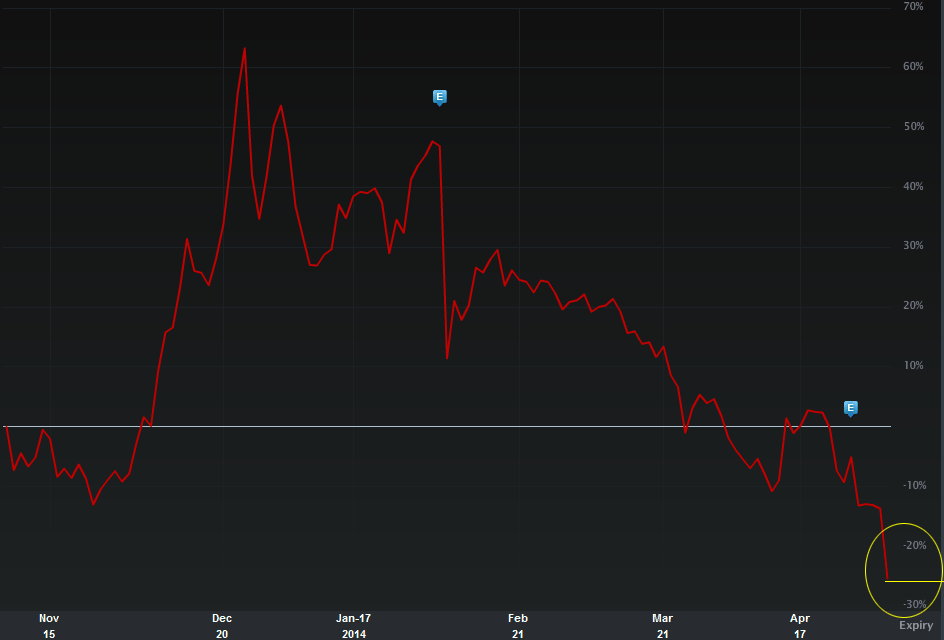
We can see the stock is at an all-time low, gapping down today and nowhere left to look for technical support (if such things matter to you). I have presented the same chart, below, but as a % return, rather than stock price.
Provided by Livevol
I note here, simply, that TWTR is down ~25% from it's IPO close. Whoa...
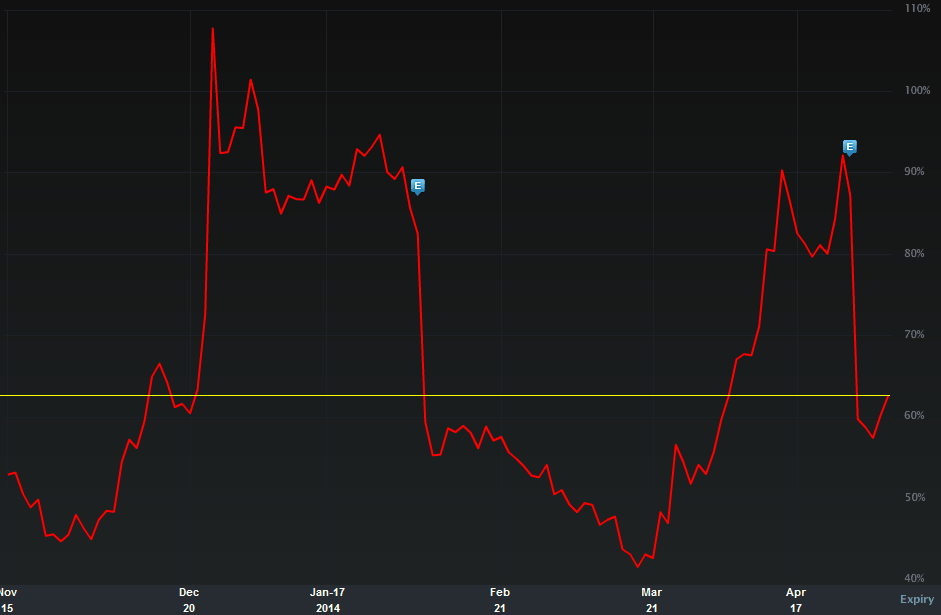
Let's turn to the IV30™ chart in isolation, below. This where the story gets even more compelling.
Provided by Livevol
The option market calls risk "implied volatility" and as of right now the risk as reflected by the option market is in the 31st percentile (so, kinda low ish). That number is considerably skewed by the massive volatility in TWTR of over 100% in Dec of last year. I wrote about that phenomenon and how ridiculous the volatility looked before that time (too low). You can read that post here:
TWTR - UPDATE: How the Option Market Totally Blew It, And We Knew it Two-Weeks Ago.
In that two week series I noted when TWTR volatility was priced to 57%... two weeks later the volatility was priced at 111% and the stock had move ~30%.
I don't think the volatility in TWTR is as ridiculously low right now, in fact, I don't think there's anything ridiculous about it at all, but I do think it's low. And I certainly do not believe the MOMO tech bubble deflation is done -- not even close.
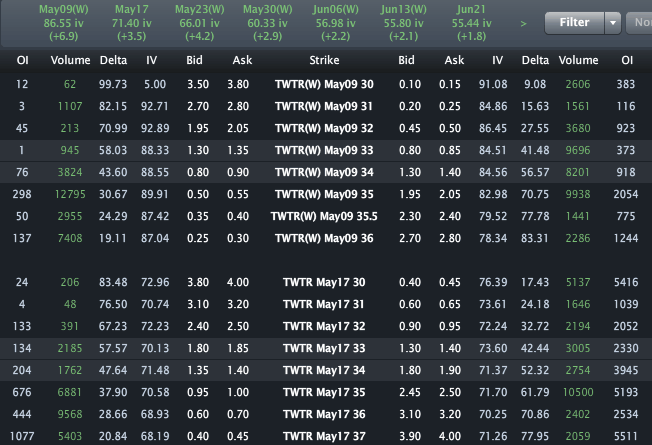
Finally, the Options Tab is included below.
Provided by Livevol
Using the $33 strike straddle in the May monthly options we can see a price range reflected by the option market of: [$29.80, $36.20] by the end of trading on Friday May 16th.
- If you believe the stock will be outside that range on expiry or any date before then, then you think the volatility is too low.
- If you believe that range is too wide, and that the stock will definitively be in that range on expiration, then you think volatility is too high.
- If you're not sure, and can make an argument for either case, then you think volatility is priced just about right.
This is trade analysis, not a recommendation.
Follow @OphirGottlieb
Tweet
Legal Stuff:
Options involve risk. Prior to buying or selling an option, an investor must receive a copy of Characteristics and Risks of Standardized Options. Investors need a broker to trade options, and must meet suitability requirements.
The information contained on this site is provided for general informational purposes, as a convenience to the readers. The materials are not a substitute for obtaining professional advice from a qualified person, firm or corporation. Consult the appropriate professional advisor for more complete and current information. I am not engaged in rendering any legal or professional services by placing these general informational materials on this website.
I specifically disclaim any liability, whether based in contract, tort, strict liability or otherwise, for any direct, indirect, incidental, consequential, or special damages arising out of or in any way connected with access to or use of the site, even if I have been advised of the possibility of such damages, including liability in connection with mistakes or omissions in, or delays in transmission of, information to or from the user, interruptions in telecommunications connections to the site or viruses.
I make no representations or warranties about the accuracy or completeness of the information contained on this website. Any links provided to other server sites are offered as a matter of convenience and in no way are meant to imply that I endorse, sponsor, promote or am affiliated with the owners of or participants in those sites, or endorse any information contained on those sites, unless expressly stated.


Ophir, how are you coming up with price range of: [$30.80, $35.80] when the ask on the 33 line is 1.40 and 1.85 (total 3.25) which would give a range of [$29.75, $36.25] by May OpEx?
ReplyDeleteYup, you're right. Was looking at weeklies. Updated. Thanks, Ron.
DeleteThe IPO price was 26$, so still 30% above...;)
Delete