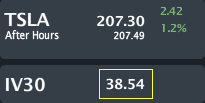
TSLA closed Friday trading at $207.30, up 1.2% with IV30™ closing at 38.54%. The Symbol Summary is included below.
Provided by Livevol
UPDATE: 6-23-2014
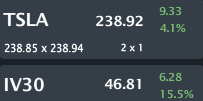
Provided by Livevol
The option market is just wrong, and it has been for several firms. The volatility priced in the option market has been absurd and has presented some of the best trading opportunities in the last decade.
6-17-2014:
NFLX, TSLA, TWTR - How the Option Market is Totally Wrong; Proof that Market Volatility Has Lost Its Mind.
... Back to May 24th...
Conclusion
A divergence has formed between the realized (aka actual) volatility in TSLA and the implied volatility (option market forward looking risk). The option market reflects less risk in TSLA shares now than it has at any point in the last year.
Perhaps the option market has fallen into a correlation malaise, applying the same risk standards across a large body of stocks (like the S&P 500) and has not (necessarily) properly identified risk in individual names.
Another two recent examples of this are TWTR and NFLX. You can read those posts here:
* Twitter (TWTR) - What Now? Option Market Reflects Low Risk; Last Two-times that Happened, Stock Moved Huge.
*Netflix (NFLX) - 5 Years of History, Evolution & Everything You Want to Know. One Day of Risk Analysis: Is the Option Market Wrong, Again?.
I have written compulsively on TSLA in the past, will likely write compulsively on TSLA in the future, and for now, I'm going to be compulsive in the present -- there is a volatility phenomenon occurring that I am compelled to share.
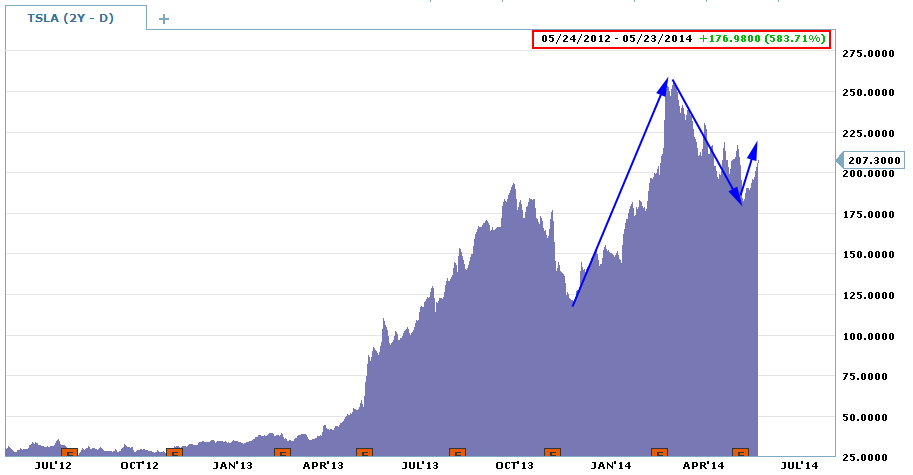
Let's get into it with the two-year stock price chart.
Provided by Charles Schwab optionsXpress
The overall stock return has been absurdly good for longs -- TSLA is up 584% in the last two-years. Perhaps more impressive is simply the fact that TSLA is a new US car manufacturer... I mean, holy s*, Elon Musk actually did it!
While the stock is up ~600% in two-years, it's the near-term that interests me.
1. The stock is down from an all-time high of $265.00 on 2-26-2014 to $207.30, or a ~22% drop in three months. TSLA certainly fell into the basket of MOMOs that went down-down.
2. The stock is up ~16% from a recent low off of earnings of $178.59 on 5-8-2014.
3. Read #1 and #2 two again. Those are large stock swings in a very short period of time.
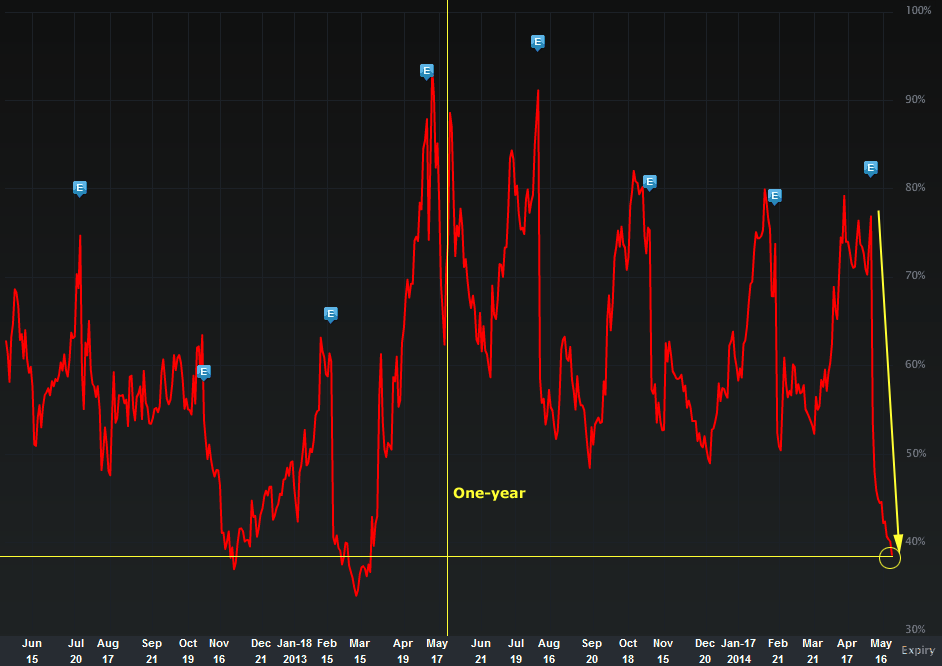
Now, let's turn to the option market and the two-year IV30™ chart in isolation, below.
Provided by Livevol
IV30™ is the risk reflected by the option market in the equity price for the next 30 calendar days (which is about 22 trading days). As of Friday, TSLA just hit a new annual low in IV30™ of 38.5%, dropping from its earnings peak of ~77%.
A vol drop after earnings is normal (news is out, risk is down), but the drop in the implied has been so precipitous it has literally fallen to unprecedented levels over the last 52 weeks (aka a new 52 wk. low).
English: The option market reflects less risk in the next 30 calendar days (~22 trading days) now than it has at any point in the last year. We can see in the chart above that the implied has only been this low three times (other than now) in the last two-years (see that horizontal yellow line I drew).
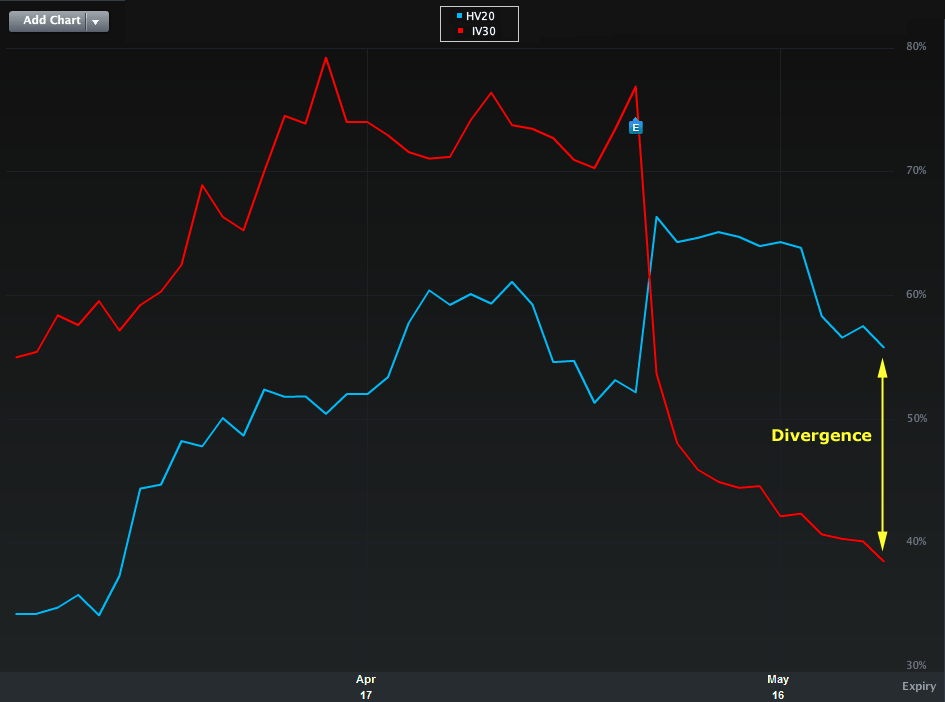
A story was just presented to you in the prior two charts... and here it is in a single chart. This is a two-month IV30™ (red) vs. HV20™ (blue) chart.
Provided by Livevol
While IV30™ is the forward looking risk, HV20™ is the realized (backward looking) stock movement. HV (historical volatility) is measured in trading days, so we use HV20™ (20 days) as the closest comparison to IV30™ (30 calendar days which is ~22 trading days). Just for the record, if you got that, you know more than half the professional option traders in the world (where IV30™ and HV30™ are usually compared). Trust me, I made option markets on NYSE ARCA and CBOE, this still hasn't filtered into the consciousness.
What Does this Chart Show?
We can see that as the forward looking volatility (red curve) has dropped in TSLA, the actual realized volatility (blue curve) has gapped up.
IV30™: 38.5% (red curve)
HV20™: 55.8% (blue curve)
Now, yes, a part of that elevated HV20™ is b/c of the earnings drop (it's a 20-day moving average which is sensitive to single day swings). But how about this:
HV30™: 55.2%
HV60 ™: 51.2%
---
HV180™: 61.4%
So, on any measure 20-days or more, the actual realized volatility of TSLA is larger than what the option market reflects for the next 30 days. In fact, the HV180™ covers 180 trading days, which is about 9-months, and that level is the highest of them all. So, one could argue, the "equilibrium" long-term realized volatility for TSLA is ~61%.
Huh?
Why does the option market reflect brand new lows in short-term stock movement for TSLA? Is this a calm time? Are we now at equilibrium? We won't know for a month, but one thing is absolutely for certain:
The option market reflects less risk in TSLA now than it has at any point in the last year.
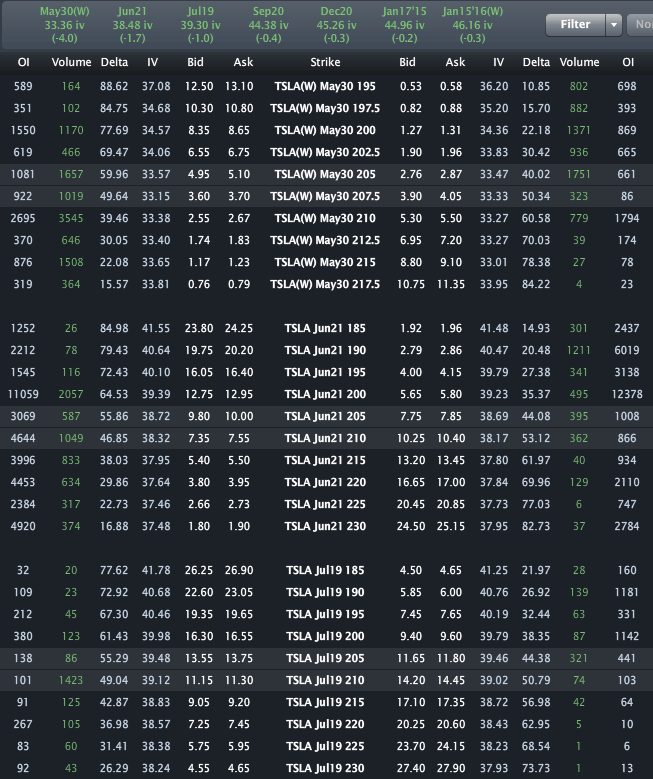
Finally, the Options Tab is included below.
Provided by Livevol
The great thing about options is that the prices reflect a clear and absolute price range "guess" for a time period.
Using the Jun $205 strike straddle, the option market prices a range of [$187.20, $222.80] by the end of trading on Jun 20th.
- If you believe the stock will be outside that range on expiry or any date before then, then you think the volatility is too low.
- If you believe that range is too wide, and that the stock will definitively be in that range on expiration, then you think volatility is too high.
- If you're not sure, and can make an argument for either case, then you think volatility is priced just about right.
This is trade analysis, not a recommendation.
Follow @OphirGottlieb
Tweet
Legal Stuff:
Options involve risk. Prior to buying or selling an option, an investor must receive a copy of Characteristics and Risks of Standardized Options. Investors need a broker to trade options, and must meet suitability requirements.
The information contained on this site is provided for general informational purposes, as a convenience to the readers. The materials are not a substitute for obtaining professional advice from a qualified person, firm or corporation. Consult the appropriate professional advisor for more complete and current information. I am not engaged in rendering any legal or professional services by placing these general informational materials on this website.
I specifically disclaim any liability, whether based in contract, tort, strict liability or otherwise, for any direct, indirect, incidental, consequential, or special damages arising out of or in any way connected with access to or use of the site, even if I have been advised of the possibility of such damages, including liability in connection with mistakes or omissions in, or delays in transmission of, information to or from the user, interruptions in telecommunications connections to the site or viruses.
I make no representations or warranties about the accuracy or completeness of the information contained on this website. Any links provided to other server sites are offered as a matter of convenience and in no way are meant to imply that I endorse, sponsor, promote or am affiliated with the owners of or participants in those sites, or endorse any information contained on those sites, unless expressly stated.


No comments:
Post a Comment