Monday, July 7, 2014

7-7-14: Daily Covered Calls Report

Share on StockTwits


Requirements
  • 1 million+ shares average daily volume
  • IV > 10%
  • IV < 60% 
  • Static Return (unassigned) > 5%

This information is available via optionsXpress Toolbox --> Idea Hub


This is trade analysis, not a recommendation.


Legal Stuff:
Options involve risk. Prior to buying or selling an option, an investor must receive a copy of Characteristics and Risks of Standardized Options. Investors need a broker to trade options, and must meet suitability requirements.

The information contained on this site is provided for general informational purposes, as a convenience to the readers. The materials are not a substitute for obtaining professional advice from a qualified person, firm or corporation. Consult the appropriate professional advisor for more complete and current information. I am not engaged in rendering any legal or professional services by placing these general informational materials on this website.

I specifically disclaim any liability, whether based in contract, tort, strict liability or otherwise, for any direct, indirect, incidental, consequential, or special damages arising out of or in any way connected with access to or use of the site, even if I have been advised of the possibility of such damages, including liability in connection with mistakes or omissions in, or delays in transmission of, information to or from the user, interruptions in telecommunications connections to the site or viruses.

I make no representations or warranties about the accuracy or completeness of the information contained on this website. Any links provided to other server sites are offered as a matter of convenience and in no way are meant to imply that I endorse, sponsor, promote or am affiliated with the owners of or participants in those sites, or endorse any information contained on those sites, unless expressly stated.

Sunday, July 6, 2014

* Preparation: Must Know for the Week to Come; Must Know from Last Week

Share on StockTwits

Last Week: Must Know
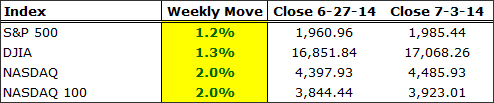
Last week was a big one.  While the S&P 500 and Dow Jones Industrial Average rose to all-time highs (again), this time it was data focused.


Data provided, Yahoo! Finance, Charles Schwab optionsXpress

Read: 3 Simple Charts That Explain the Bull Market

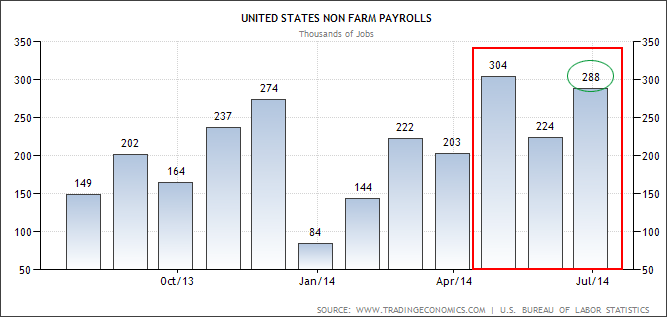
The job numbers were simply huge and the unemployment rate dropped to 6.1%.  Here's a chart, then some commentary.


Data provided by Trading Economics

---
United States added 288,000 jobs in June, up from 224,000 in the previous month. Over the past 3 months, job growth has averaged 272,000 per month. Employment growth was widespread [].

Source: Trading Economics
---


Not only did that 288K number blow passed the 212K estimate, but the May number was revised up from 282K to 304K.

And better news...

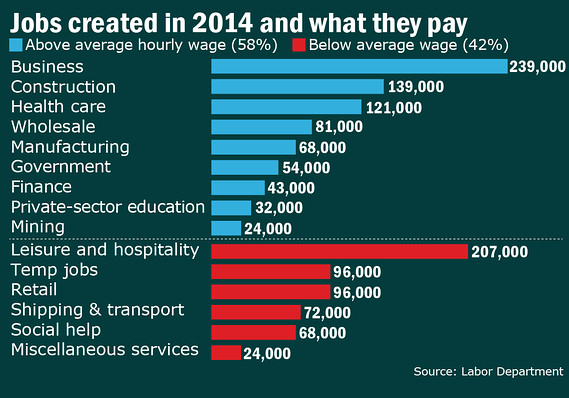
More than half of 2014′s new jobs pay higher than average wage


Data provided by MarketWatch

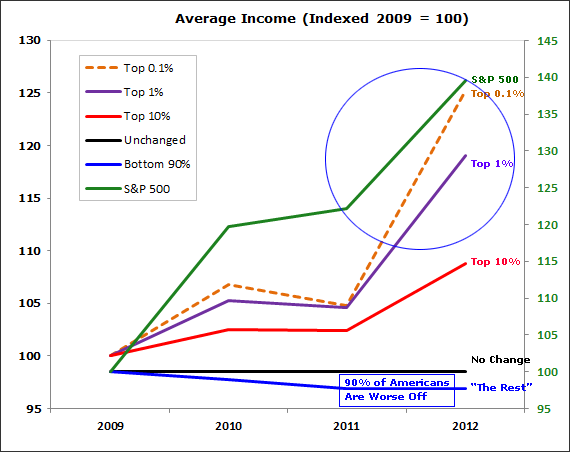
That is a stark difference from what we had seen up until this year, where wages and wealth were lower for 90% of the American Population.


We can see in the chart above that the bull market has in fact been the greatest wealth redistribution vehicle ever. The bull market has created huge wealth for the the top 10%, 1% and even the top 0.1% while 90% of Americans ("the rest") are worse off.

But the data for 2014 with respect to wages may be a turning point.

Last Week: Phenomena We Must Know
6-26-2014
Americans are Not Participating in the Economic Recovery.

7-3-2014
Is China a State Backed Accounting Fraud?

7-5-2014
Three Simple Charts That Tell Us... Everything

Last Week: Stats Must Know
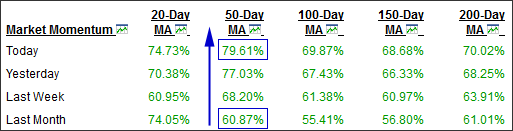
Momentum remains very high after it re-entered the market several weeks ago.

* As of Friday: 79.6% of stocks are now trading above their 50-day MA
* As of 1-month Ago: 60.91% of stocks were trading above their 50-day MA
* As of 6-weeks Ago: 40.8% of stocks were trading above their 50-day MA


Provided by BarChart.com

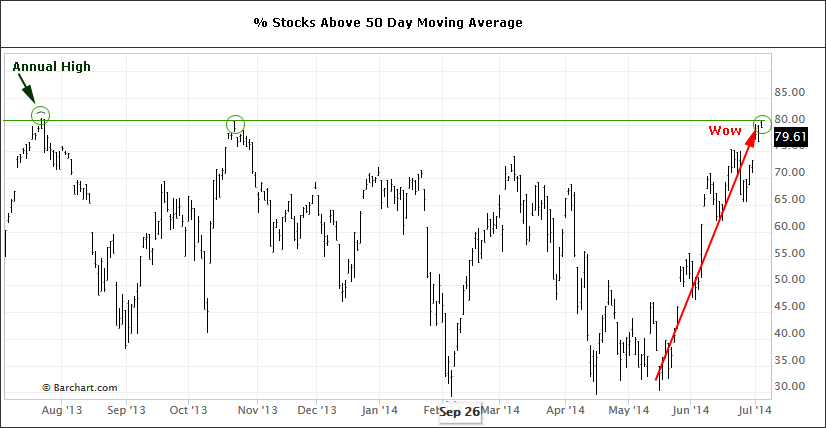
A little perspective is needed given those enormous gains in momentum, and here it is.  a one-year chart of the percentage of companies trading above their 50 day moving average.

Provided by BarChart.com

Yep... just at that annual high (80%) hit in August of last year.

Last Week: Must Know Headlines:
* More than half of 2014′s new jobs pay higher than average wage

* Startling news for investors, Yellen and Congress

* The real reason Americans are disgusted with government

* For most families, wealth has vanished


This Week: Must Know
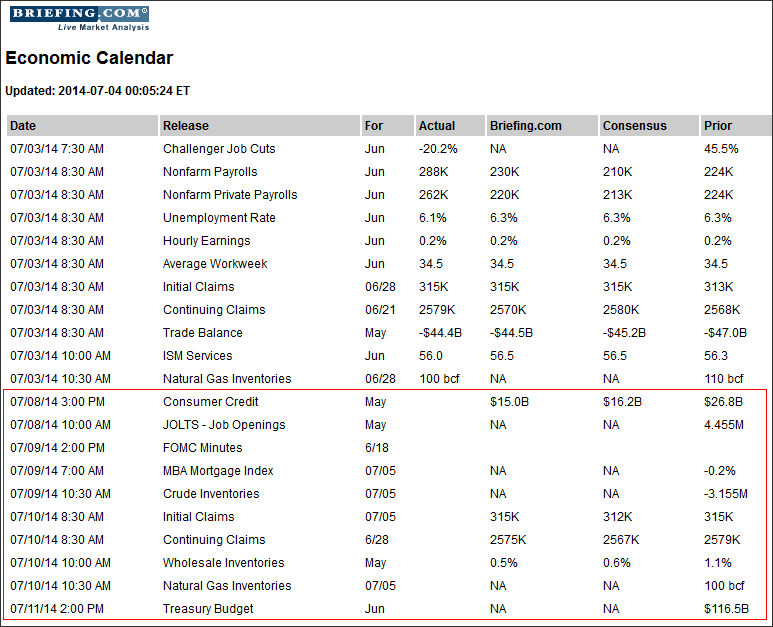
This week is rather light on the economic calendar, although we must note that the United States Federal Reserve and the European Central Bank may be moving in opposite directions. While the US is cutting QE and eying rate hikes in the relatively near future, the ECB is looking to begin QE and cut rates last month.

One caveat is the UK where a housing bubble may be in effect with prices rising 26% year over year.  Expectations are for a rate hike in the UK soon, perhaps before year end.

Below you will find all that we need to prepare for the week to come

All data and images for this report are provided by Charles Schwab optionsXpress

This Week: Economic Calendar


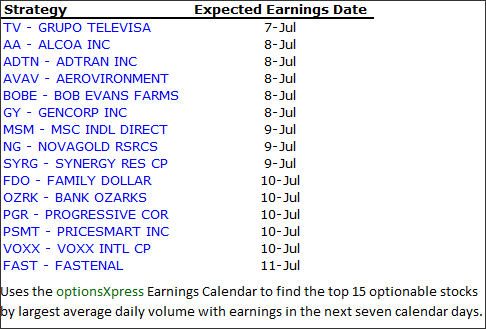
Partial List of Noteworthy Earnings This Week
The 15 most optionable earnings events; a relatively quiet week as we have moved well out of earnings season. Here's a list of tradable (liquid) earnings events.


This is trade analysis, not a recommendation.


Legal Stuff:
Options involve risk. Prior to buying or selling an option, an investor must receive a copy of Characteristics and Risks of Standardized Options. Investors need a broker to trade options, and must meet suitability requirements.

The information contained on this site is provided for general informational purposes, as a convenience to the readers. The materials are not a substitute for obtaining professional advice from a qualified person, firm or corporation. Consult the appropriate professional advisor for more complete and current information. I am not engaged in rendering any legal or professional services by placing these general informational materials on this website.

I specifically disclaim any liability, whether based in contract, tort, strict liability or otherwise, for any direct, indirect, incidental, consequential, or special damages arising out of or in any way connected with access to or use of the site, even if I have been advised of the possibility of such damages, including liability in connection with mistakes or omissions in, or delays in transmission of, information to or from the user, interruptions in telecommunications connections to the site or viruses.

I make no representations or warranties about the accuracy or completeness of the information contained on this website. Any links provided to other server sites are offered as a matter of convenience and in no way are meant to imply that I endorse, sponsor, promote or am affiliated with the owners of or participants in those sites, or endorse any information contained on those sites, unless expressly stated.

Saturday, July 5, 2014

* Three Simple Charts That Tell Us... Everything

Share on StockTwits

There a lot of charts out there. I've posted dozens... But sometimes, it doesn't take a great scientific discovery or data mining to understand that what and why.

Here are the three simplest charts possible, and they really do tell us... everything (note that 2014 Q1 GDP was apparently a blip).

UPDATE
You can read this post (the bearish version) too: Three (More) Simple Charts That Tell Us... Something Else

Chart #1: S&P 500 vs. GDP, both indexed to Dec. 1 2007.

Provided by The Federal Reserve

I'm not claiming causality, but:
  1. GDP goes up, the market goes up.
  2. GDP goes down, the market goes down.

Chart #2: S&P 500 vs. Unemployment Rate

Provided by The Federal Reserve

I'm not claiming causality, but:
  1. Unemployment rate goes up, the market goes down.
  2. Unemployment rate goes down, the market goes up.

Chart #3: GDP vs. Unemployment Rate

Provided by The Federal Reserve

I'm not claiming causality, but:
  1. Unemployment rate goes up, GDP goes down.
  2. Unemployment rate goes down, GDP goes up. 
Why Do I Mention Causality?
Just because two things move in a pattern together does not mean one causes the other. If there is no causality, then there is a "lurking variable." One such lurking variable could be QE (as an example).

And the counterarguments to "everything is OK":

* Americans are Not Participating in the Economic Recovery or the Bull Market

* 10 Facts that May Rock Your World: Has the Last Year Been an Artificially Driven Stock Rally?


This is trade analysis, not a recommendation.


Legal Stuff:
Options involve risk. Prior to buying or selling an option, an investor must receive a copy of Characteristics and Risks of Standardized Options. Investors need a broker to trade options, and must meet suitability requirements.

The information contained on this site is provided for general informational purposes, as a convenience to the readers. The materials are not a substitute for obtaining professional advice from a qualified person, firm or corporation. Consult the appropriate professional advisor for more complete and current information. I am not engaged in rendering any legal or professional services by placing these general informational materials on this website.

I specifically disclaim any liability, whether based in contract, tort, strict liability or otherwise, for any direct, indirect, incidental, consequential, or special damages arising out of or in any way connected with access to or use of the site, even if I have been advised of the possibility of such damages, including liability in connection with mistakes or omissions in, or delays in transmission of, information to or from the user, interruptions in telecommunications connections to the site or viruses.

I make no representations or warranties about the accuracy or completeness of the information contained on this website. Any links provided to other server sites are offered as a matter of convenience and in no way are meant to imply that I endorse, sponsor, promote or am affiliated with the owners of or participants in those sites, or endorse any information contained on those sites, unless expressly stated.

Thursday, July 3, 2014

7-3-14: End of Day Report - Largest Stock Moves, New 52 Wk. Highs/Lows, Unusual Option Volume

Share on StockTwits


Top Headlines
* Jobs drive Dow, S&P 500 to records in short session

* More than half of 2014′s new jobs pay higher than average wage

* Dow, S&P end strong week at record highs


Top option Story
* Is China a State Backed Accounting Fraud? Has Worldwide Risk Malaise Made the World Riskier?

Open Interest
* Daily Open Interest Report

Covered Call
* Daily Covered Call Report

Biotech Index
* Daily Biotech Small & Micro Cap Update

Market Overview

Largest Stock Gainers


Largest Stock Losers


New 52 Wk Highs in S&P 500


New 52 Wk Lows in S&P 500
No New Lows


Unusual Option Volume


Elevated Implied Volatility (IV) to Historical Volatility (HV)


This is trade analysis, not a recommendation.


Legal Stuff:
Options involve risk. Prior to buying or selling an option, an investor must receive a copy of Characteristics and Risks of Standardized Options. Investors need a broker to trade options, and must meet suitability requirements.

The information contained on this site is provided for general informational purposes, as a convenience to the readers. The materials are not a substitute for obtaining professional advice from a qualified person, firm or corporation. Consult the appropriate professional advisor for more complete and current information. I am not engaged in rendering any legal or professional services by placing these general informational materials on this website.

I specifically disclaim any liability, whether based in contract, tort, strict liability or otherwise, for any direct, indirect, incidental, consequential, or special damages arising out of or in any way connected with access to or use of the site, even if I have been advised of the possibility of such damages, including liability in connection with mistakes or omissions in, or delays in transmission of, information to or from the user, interruptions in telecommunications connections to the site or viruses.

I make no representations or warranties about the accuracy or completeness of the information contained on this website. Any links provided to other server sites are offered as a matter of convenience and in no way are meant to imply that I endorse, sponsor, promote or am affiliated with the owners of or participants in those sites, or endorse any information contained on those sites, unless expressly stated.

7-3-14: Daily Biotech Small & Micro Cap Update

Share on StockTwits

The Ophir Gottlieb Small Cap Biotech Index
Is this the biotech revolution or the biotech bust?


Notable Stock Movers
PVCT+12.12%
ABIO+8.78%
SNTA+7.91%
CAPS-5.81%
AVXL-8.33%
MRNA-9.7%

Unusually Heavy Option Volume
SPPI:775% of daily average
AGEN:425% of daily average
TRGT:403% of daily average

231 small / micro cap biotech and pharma companies (equal weighted):
  • Public Biotech and Pharma Companies
  • Trade on North American Exchanges
  • Market Cap Range: [$0, $2 Billion]
  • Price, Employees, Revenue Range: Any


More on index construction and performance: The Ophir Gottlieb Small Cap Biotech Index

Today's Biotech Index Stock Movers


Today's Biotech Index Unusual Option Volume


Full Index Constituents and Moves


This is trade analysis, not a recommendation.


Legal Stuff:
Options involve risk. Prior to buying or selling an option, an investor must receive a copy of Characteristics and Risks of Standardized Options. Investors need a broker to trade options, and must meet suitability requirements.

The information contained on this site is provided for general informational purposes, as a convenience to the readers. The materials are not a substitute for obtaining professional advice from a qualified person, firm or corporation. Consult the appropriate professional advisor for more complete and current information. I am not engaged in rendering any legal or professional services by placing these general informational materials on this website.

I specifically disclaim any liability, whether based in contract, tort, strict liability or otherwise, for any direct, indirect, incidental, consequential, or special damages arising out of or in any way connected with access to or use of the site, even if I have been advised of the possibility of such damages, including liability in connection with mistakes or omissions in, or delays in transmission of, information to or from the user, interruptions in telecommunications connections to the site or viruses.

I make no representations or warranties about the accuracy or completeness of the information contained on this website. Any links provided to other server sites are offered as a matter of convenience and in no way are meant to imply that I endorse, sponsor, promote or am affiliated with the owners of or participants in those sites, or endorse any information contained on those sites, unless expressly stated.

* Is China a State Backed Accounting Fraud? Has Worldwide Risk Malaise Made the World Riskier?

Share on StockTwits

This note follows several years and asks a simple (yet complicated) question:
Is China a State Backed Accounting Fraud?

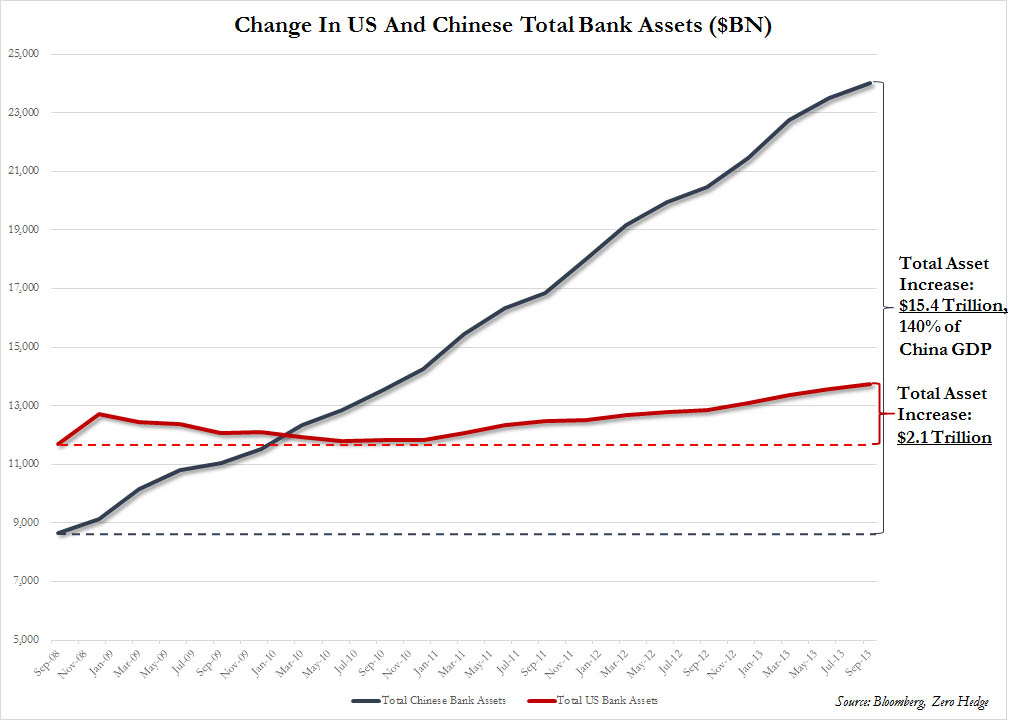
First a chart from ZeroHedge (Change in Total bank Assets)
Provided by Zerohedge

That number for China is now 2.5x GDP.

"Putting the rate of change in perspective, while the Fed was actively pumping $85 billion per month into US banks for a total of $1 trillion each year, in just the trailing 12 months ended September 30, Chinese bank assets grew by a mind-blowing $3.6 trillion!"
Source: Global Research

A step back...

I think we have all been tracking the disturbingly high number of frauds (or fraud accusations) for Chinese firms trading as ADRs on US exchanges.

Here's an article I posted on Sep 29th, 2011:
Is China A State Backed Accounting Fraud Epidemic?

But this goes even further.

5-26-2011: The Audacity of Chinese Frauds (WSJ)

and...

9-29-2011: Chinese Stocks Crushed on Report of DOJ Probe (WSJ)

And yet further... There have also been a disturbing number of frauds surrounding mainland China and the flavor of the month this time is metals.  This is 2014:

---
Chinese authorities raised concerns about the use of gold to back loans, saying they had discovered billions of dollars of "improper" transactions, as companies exposed to a separate case of potential fraud involving copper- and aluminum-linked lending discussed a deal to share the possible losses.

Source: China Flags 'Improper' Gold-Backed Loans, written by Enda Curran, Sarah Kent and Chuin-Wei Yap.
---

The real question is, how much of the information coming from China is real?  If it isn't real, is it little "fudges" that basically affect only the fringes, or is it "big f*ing deal" misrepresentation?

Is it truly government backed, or just a lack of controls?

Keep in mind, before we finger wag, the United States went through its own Fraud Epidemic in 2002: Enron, WorldCom, Tyco, Health South, Quest, Adelphia... need I go on?...

But, while the United States essentially got crushed with the fraud epidemic, China so far has not.  In fact, economic data from China all of a sudden took a turn for the positive this month.  Check this out:

---
China’s Purchasing Managers Index, or PMI hit a six month high on Tuesday to close the month of June at 51. It as 50.8 in May. The rise shows continued momentum in the Chinese economy.

On Monday, China’s President Xi Jinping warned the Communist Party not to be complacent with the reform agenda now that the economy is heading in the right direction. Investors have been watching for signs of progress as China slowly opens its economy to foreign investment and shifts gears from an export driven economy to a more domestic consumer focused one.

Source: Forbes China PMI Index Hits New Heights
---

But just six months ago we had this:
---
China's economy displayed clear signs of a slowdown in December, with a business survey of the service sector adding to recent pessimism—and showing that both manufacturing and services are weakening simultaneously for the first time in months.

Source: The Wall Street Journal Survey Indicates Worsening Economy
---

And three months ago we had: "China's economy grew at its slowest pace in 18 months at the start of 2014" as of April 16th, 2014." China economic growth slows to 18-month low in first-quarter via Reuters.

And four months ago we had: China Is Crashing. Credit Bubble, Financial and Industrial Bankruptcies, Debt and Bond Busts

Here are a bunch of headlines surrounding the entire issue and really point to the mass confusion:

5-26-2011: The Audacity of Chinese Frauds (WSJ)

9-29-2011: Chinese Stocks Crushed on Report of DOJ Probe (WSJ)

4-16-2014: China economic growth slows to 18-month low in first-quarter (Reuters)

3-8-2014: China Is Crashing. Credit Bubble, Financial and Industrial Bankruptcies, Debt and Bond Busts (Global Ressarch)

5-19-2014: Is China’s Housing Bubble Beginning to Burst? (Bloomberg)

6-26-2014: China Flags 'Improper' Gold-Backed Loans (WSJ)

7-1-2014: China PMI Index Hits New Heights (Forbes)

The thing is, opaque reporting and communication, whether it be by company or by country means one thing: Risk. But the world isn't pricing in risk right now... not for anything.  In fact, we are in a whirlwind of risk malaise.

So is China in a bubble or not?  Is China a fraud or not?  Does any of it matter or not?

So far, for all the incredible data and very smart people that have provided the data, like this:
Has the Chinese Apocalypse Started? Is China on the Cusp of a Deflationary Vortex? where I source Gordon Chang.

The answer has simply been... 'No. None of this matters.'

And the second question: 'Will it ever matter?'

And the answer, in my opinion, 'yes, it will.'

Recommended reading: The "Miracle" Of China's PMI Resurrection In 1 Uncomfortable Chart via ZeroHedge.

This is trade analysis, not a recommendation.


Legal Stuff:
Options involve risk. Prior to buying or selling an option, an investor must receive a copy of Characteristics and Risks of Standardized Options. Investors need a broker to trade options, and must meet suitability requirements.

The information contained on this site is provided for general informational purposes, as a convenience to the readers. The materials are not a substitute for obtaining professional advice from a qualified person, firm or corporation. Consult the appropriate professional advisor for more complete and current information. I am not engaged in rendering any legal or professional services by placing these general informational materials on this website.

I specifically disclaim any liability, whether based in contract, tort, strict liability or otherwise, for any direct, indirect, incidental, consequential, or special damages arising out of or in any way connected with access to or use of the site, even if I have been advised of the possibility of such damages, including liability in connection with mistakes or omissions in, or delays in transmission of, information to or from the user, interruptions in telecommunications connections to the site or viruses.

I make no representations or warranties about the accuracy or completeness of the information contained on this website. Any links provided to other server sites are offered as a matter of convenience and in no way are meant to imply that I endorse, sponsor, promote or am affiliated with the owners of or participants in those sites, or endorse any information contained on those sites, unless expressly stated.