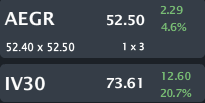
AEGR is trading $52.50, up 4.6% with IV30™ up 20.7%. The Symbol Summary is included below.
Provided by Livevol
Aegerion Pharmaceuticals, Inc. (Aegerio) is a biopharmaceutical company focused on the development and commercialization of therapeutics to treat lipid disorders.
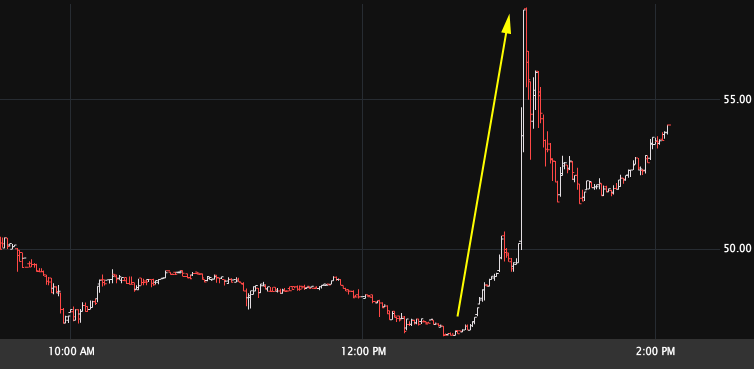
This is a volatility, stock and suspicious order flow note on a pharma that has seen some rather unusual activity in the stock price of late. In fact, let's start with today. I have included the tick chart (1-minute) for AEGR, below.
Provided by Livevol
Note that the stock opened at $50.15, hit a low of $47.11, and then exploded up to $58.08 in a matter of minutes, before falling back down to the mid range of $52.50. As I'm writing, the stock has moved back up to $55.19.
So what happened today? I have no idea... But someone else may have an idea. Let's first turn to the Stats Tab, below.

Provided by Livevol
Simply said, the company averages 977 calls traded across all strikes and all expiries per day. So what?... Well, this trade came across the tape two hours before that stock pop:

Provided by Livevol
1800 Mar 50 calls were purchased for $2.20. As of the close, those calls are worth ~$7.00. That's 1800x100x($7.00 - $2.20) = $864,000 profit in three hours.
Now let's turn to a broader view of the stock and volatility, and hope that $864K winner was in fact not a cheater.
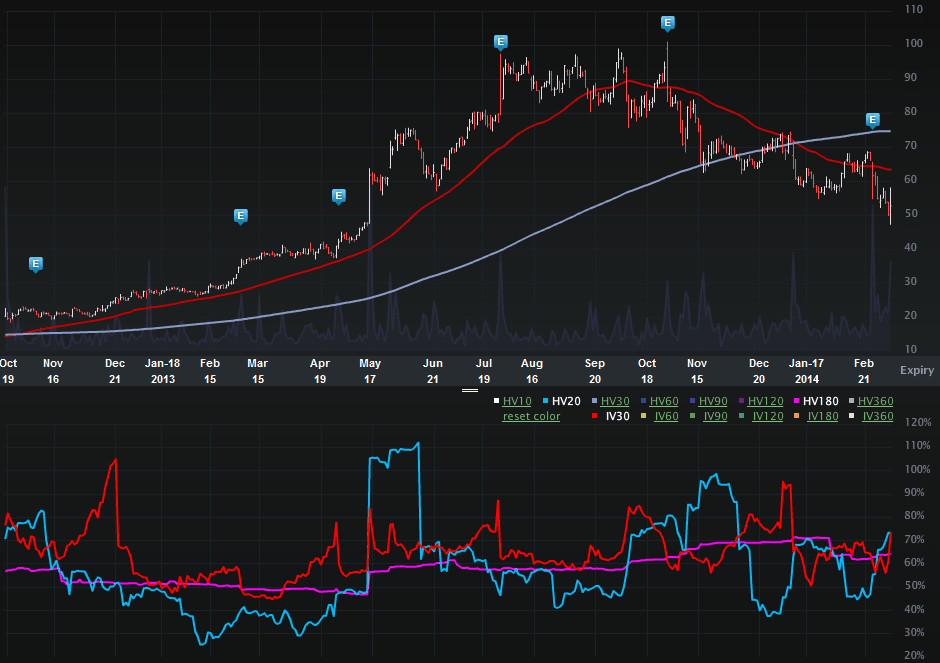
The Charts Tab (1.5 years) is below. The top portion is the stock price, the bottom is the vol (IV30™ - red vs HV20™ - blue vs HV180™ - pink).
Provided by Livevol
Note that the stock was ~$20 and has risen more than 150% in the last 18 months. But, also note the rather staggering stock drop since the peak off of earnings of $101 on 10-30-2013. From that point, the stock is down ~45%. So, timing is everything as to whether this was a winning investment over time.
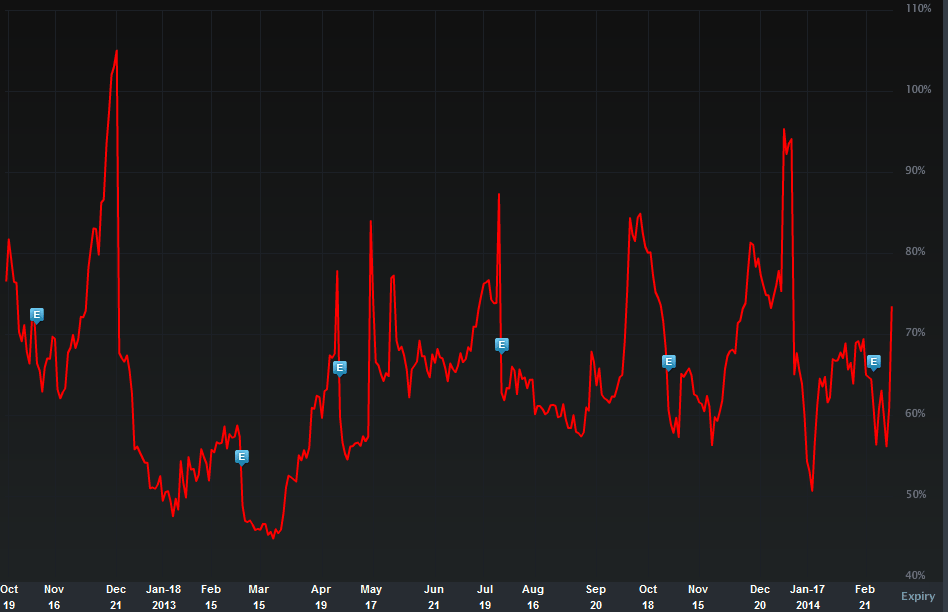
But there's an oddity in the volatility that I see.. and it's really odd. Let's turn to the IV30™ chart in isolation, below.
Provided by Livevol
Note that the IV30™ hit ~95% in January and has been dipping since then even as the stock has dropped from ~$75 at that time. Normally a stock's implied volatility rises as the stock price drops. And a baby pharma, lower volatility with a catapulting price -- that's not something you see everyday.
But take a look at the tail end (the right hand side) of that volatility chart. We see a spike of late, and by the movement of the stock today, I'd say more risk reflected by the option market sounds about right.
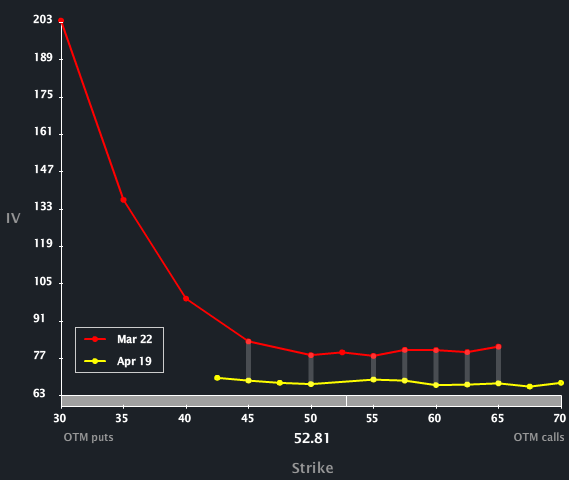
But something is afoot in AEGR, and we can see it in the next two images. First, the Skew Tab snap (below) illustrates the vols by strike by month.
Provided by Livevol
Note that Mar volatility is elevated to Apr across all strikes. We know that AEGR just released earnings on 2-26-2014, so that ain't earnings vol, but it may be "event" vol. Let's turn to the Options Tab to see that volatility difference, numerically.
To read more about skew, what is and why it exists you can click the title below:
Understanding Option Skew -- What it is and Why it Exists.
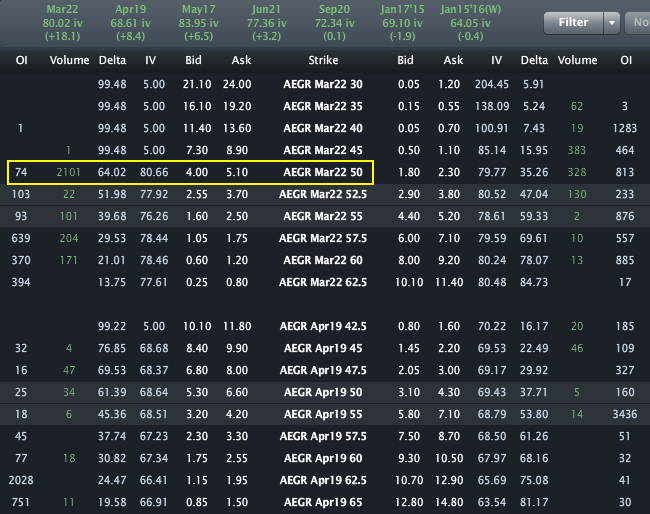
Finally, the Options Tab is included below (midday quotes, not the close).
Provided by Livevol
We can see across the top (the green numbers) that Mar vol is priced to 80.02% up 18.1 volatility points today, while Apr vol is priced to 68.61% up 8.4 volatility points.
So, two phenomena here:
1. Again, Mar is clearly elevated to Apr.
2. As of yesterday, Mar and Apr vol were pretty much the same.
So... Something happened today, some news, some event, some "something" that not only popped the stock midday, but also pushed the risk in Mar substantially higher than Apr as reflected by the option market.
This is trade analysis, not a recommendation.
Follow @OphirGottlieb
Tweet
Legal Stuff:
Options involve risk. Prior to buying or selling an option, an investor must receive a copy of Characteristics and Risks of Standardized Options. Investors need a broker to trade options, and must meet suitability requirements.
The information contained on this site is provided for general informational purposes, as a convenience to the readers. The materials are not a substitute for obtaining professional advice from a qualified person, firm or corporation. Consult the appropriate professional advisor for more complete and current information. I am not engaged in rendering any legal or professional services by placing these general informational materials on this website.
I specifically disclaim any liability, whether based in contract, tort, strict liability or otherwise, for any direct, indirect, incidental, consequential, or special damages arising out of or in any way connected with access to or use of the site, even if I have been advised of the possibility of such damages, including liability in connection with mistakes or omissions in, or delays in transmission of, information to or from the user, interruptions in telecommunications connections to the site or viruses.
I make no representations or warranties about the accuracy or completeness of the information contained on this website. Any links provided to other server sites are offered as a matter of convenience and in no way are meant to imply that I endorse, sponsor, promote or am affiliated with the owners of or participants in those sites, or endorse any information contained on those sites, unless expressly stated.


Clinical breakdown of that trade. If the SEC were conducting their "investigations" in the same manner that you are a lot more shady things would be detected and stopped. Well done!
ReplyDelete