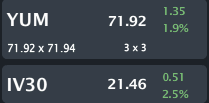
YUM is trading $71.92, up 1.9% with IV30™ up 2.5%. The Symbol Summary is included below.

Provided by Livevol
Yum! Brands, Inc. (YUM) is a quick service restaurant company based on number of system units, with approximately 37,000 units in more than 120 countries and territories. The Company through its three concepts of KFC, Pizza Hut and Taco Bell (the Concepts), develops, operates, franchises and licenses a worldwide system of restaurants, which prepare, package and sell a menu of priced food items. Units are operated by a Concept or by independent franchisees or licensees under the terms of franchise or license agreements.
The stock just came up on a real-time custom scan. This one hunts for calendar spreads between the front two months. And while Nov expiry is just days away, this vol diff opened up today and is worth a look.
Custom Scan Details
Stock Price GTE $5
Sigma1 - Sigma2 GTE 8
Average Option Volume GTE 1,000
Industry isNot Bio-tech
Days After Earnings GTE 5 LTE 70
Sigma1, Sigma2 GTE 1
The goal with this scan is to identify back months that are cheaper than the front by at least 8 vol points. I'm also looking for a reasonable amount of liquidity in the options (thus the minimum average option volume), want to avoid bio-techs (and their crazy vol) and make sure I'm not selling elevated front month vol simply because earnings are approaching.
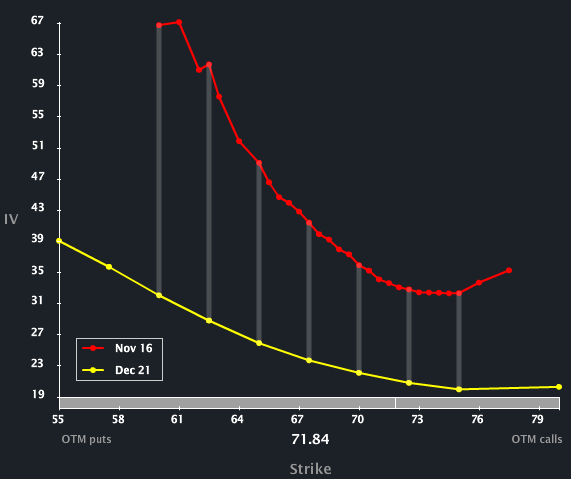
Let's start with the Skew Tab, below.

Provided by Livevol
We can see two phenomena here:
1. The red curve (Nov option volatility) is above the yellow curve (Dec option volatility) for all strike prices.
2. The red curve (Nov options) shows a distinct bend to the downside, which means the out-of-the-money puts (OTM) are priced higher than the at-the-money (ATM) options and the OTM calls. There's also a small upside bend to the OTM calls. In English, the option market reflects a higher likelihood of both an upside or downside move in YUM stock price in the near-term (the next four calendar days) than it does in the medium-term (December expiration).
To read about option skew, what it is and why it exists, you can read the post below by clicking on the title:
Understanding Option Skew -- What it is and Why it Exists
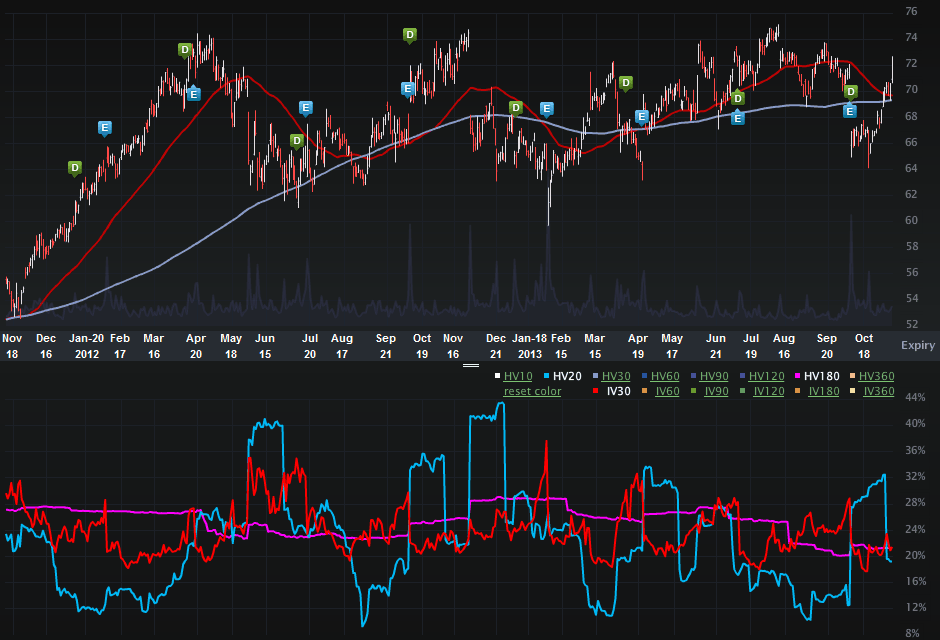
Now we can turn to the two-year Charts Tab (below). The top portion is the stock price, the bottom is the vol (IV30™ - red vs HV20™ - blue vs HV180™ - pink).

Provided by Livevol
On the stock side we can see a nice appreciation from the low $50's to now over $70. Looking a bit more myopically we can see YUM stock rise from $66.48 on 10-9-2013 off of a disappointing earnings release (the blue "E" icon represents an earnings date) back to $71.92 in about a month. So, the stock has recovered to pre-earnings levels.
What's interesting about today is that while the stock is up, the implied volatility is up too. Further, the IV move in Nov is substantially larger than Dec (which we'll see below), and that difference has created a wider time spread.
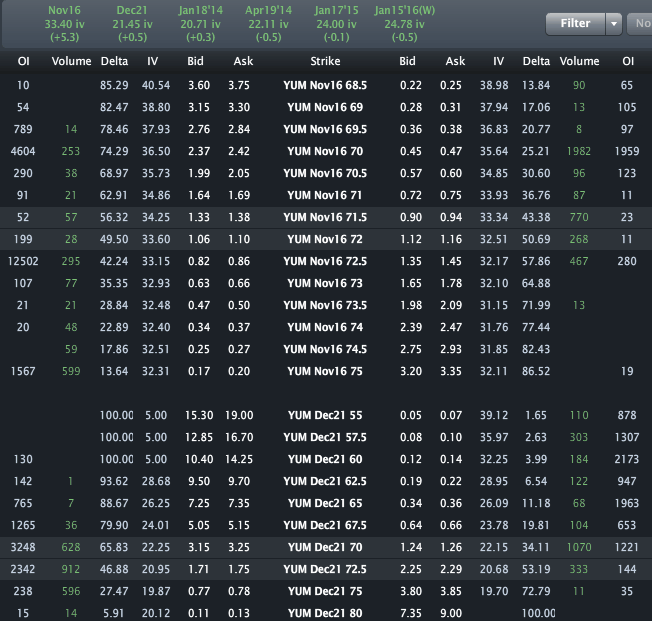
Finally, let's look to the Options Tab (below).

Provided by Livevol
Across the top we can see the monthly vols are priced to 33.40% for Nov and 21.45% for Dec. Also note the little green numbers in parenthesis below the monthly vols numbers -- Nov is up 5.3 volatility points today while Dec is up just 0.5 volatility points. The end result is that calendar spread we see in the Skew Tab. This has certainly turned into a compelling short-term volatility phenomenon.
This is trade analysis, not a recommendation.
Follow @OphirGottlieb
Tweet
Legal Stuff:
Options involve risk. Prior to buying or selling an option, an investor must receive a copy of Characteristics and Risks of Standardized Options. Investors need a broker to trade options, and must meet suitability requirements.
The information contained on this site is provided for general informational purposes, as a convenience to the readers. The materials are not a substitute for obtaining professional advice from a qualified person, firm or corporation. Consult the appropriate professional advisor for more complete and current information. I am not engaged in rendering any legal or professional services by placing these general informational materials on this website.
I specifically disclaims any liability, whether based in contract, tort, strict liability or otherwise, for any direct, indirect, incidental, consequential, or special damages arising out of or in any way connected with access to or use of the site, even if I have been advised of the possibility of such damages, including liability in connection with mistakes or omissions in, or delays in transmission of, information to or from the user, interruptions in telecommunications connections to the site or viruses.
I make no representations or warranties about the accuracy or completeness of the information contained on this website. Any links provided to other server sites are offered as a matter of convenience and in no way are meant to imply that I endorse, sponsor, promote or am affiliated with the owners of or participants in those sites, or endorse any information contained on those sites, unless expressly stated.


No comments:
Post a Comment