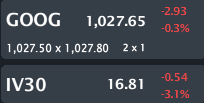
Provided by Livevol
Google Inc. (Google) is a global technology company. The Company’s business is primarily focused around key areas, such as search, advertising, operating systems and platforms, enterprise and hardware products.
This is a volatility note, specifically a depressed volatility note on GOOG relative not just to the last year's IV30™, but just as compelling, to the long-run trend in GOOG's historical realized volatility.
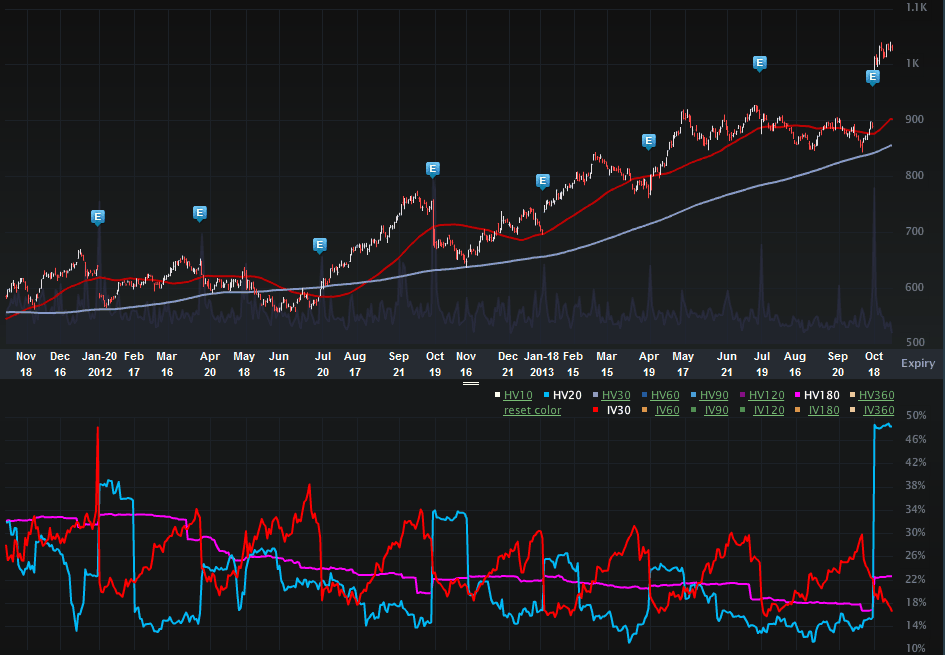
Let's start with the Charts Tab (two-years) below. The top portion is the stock price, the bottom is the vol (IV30™ - red vs HV20™ - blue vs HV180™ - pink).
Provided by Livevol
On the stock side we can se the well known story, GOOG has been ripping. Two-years ago this was a $584 stock and today we can see it trading in 4 digits up more than 75% or $150 billion in market cap. Whoa...
I recently wrote about GOOG and the reaction the stock had to earnings. You can read that post by clicking on the title below:
Google (GOOG) - Are We in a Bubble? Earnings Good, but Stock Hyper Reacts to Upside
But today, I am fascinated by the volatility, on three counts. First, look at the pink curve in the bottom half of the chart above. That represents the HV180™, which in English is the average annualized realized movement in the stock over the last 180 trading days (which is about 8 months in a calendar year). Compare the level of that pink curve to the red one (which is the IV30™ -- the forward looking 30-day implied volatility).
HV180™: 22.66%
IV30™: 16.81%
So the option market is pricing less stock movement in GOOG over the next 30-days as the stock has realized on average in the last 180 trading days. Hmmm...
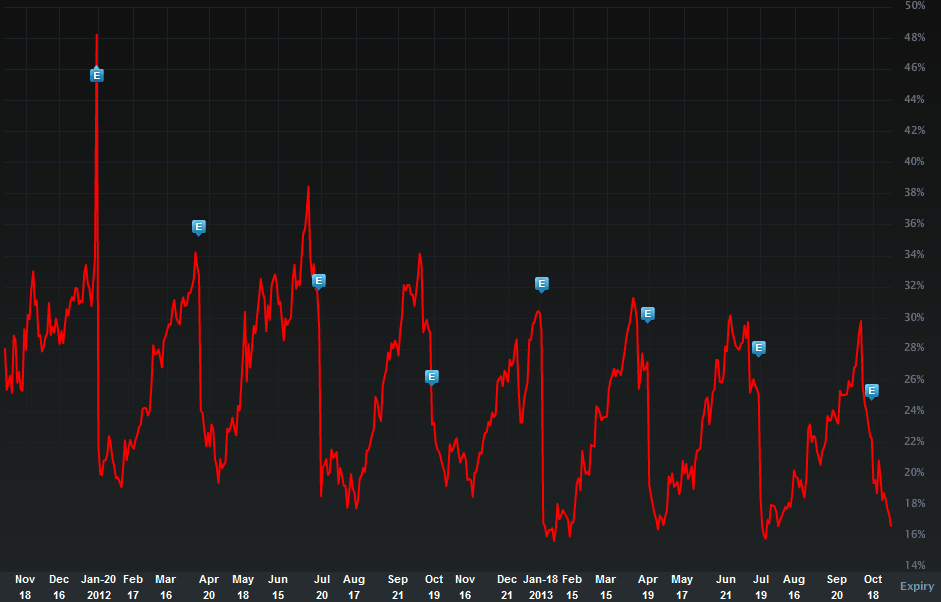
Let's turn to the two-year IV30™ chart in isolation, below.
Provided by Livevol
The blue "E" icons represent earnings releases and we can see that natural rise and fall of volatility into and then out of those events. I note two things here:
(1) The peaks into earnings are getting lower -- it's not monotonic but it is apparent.
(2) Look how low the IV30™ is right now. Relative to the last year it's in the 6th percentile.
So what? Well, it does appear that GOOG has reached a sort of equilibrium per the option market, and on the upside that makes sense. If it were to rise 75% again, it would be the largest company in the world (which may happen). But what about the downside? As the stock rises and the overall market hits and breaks all-time highs, is there not more downside risk to GOOG? I dunno, the options say, "no". I'm not sure I agree...
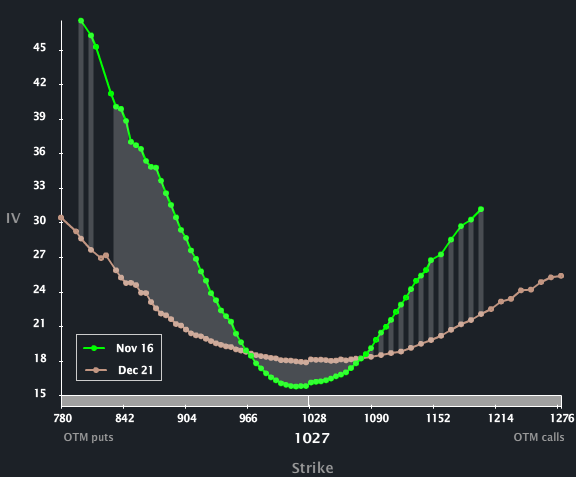
Let's turn to the Skew Tab, below.
Provided by Livevol
Look at that skew shape -- it's parabolic, reflecting both upside risk (potential) and downside risk. Skew is normally downward sloping. To read about skew, what it is and why it exists, you can read the post below by clicking on the title:
Understanding Option Skew -- What it is and Why it Exists
The downside skew doesn't surprise me, the upside, yeah, a little... Actually, a little more than a little, especially in Dec options.
Finally, let's turn to the Options Tab for completeness.
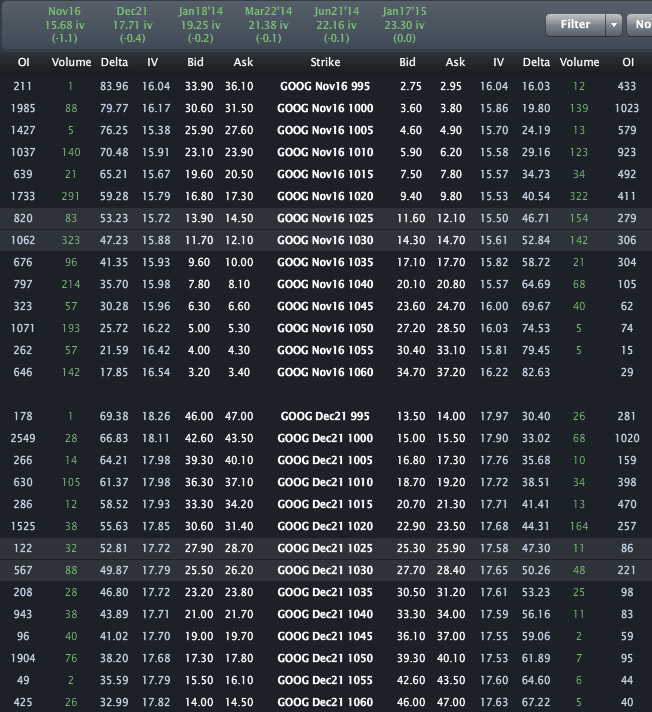
Provided by Livevol
Across the top we can see the monthly vols are priced to 15.68% for Nov and 17.71% for Dec. I do note a monotonic increase in volatility from the front months to the back months:
- 15.68%
- 17.71%
- 19.25%
- 21.38%
- 22.16%
- 23.30%
This is trade analysis, not a recommendation.
Follow @OphirGottlieb
Tweet
Legal Stuff:
Options involve risk. Prior to buying or selling an option, an investor must receive a copy of Characteristics and Risks of Standardized Options. Investors need a broker to trade options, and must meet suitability requirements.
The information contained on this site is provided for general informational purposes, as a convenience to the readers. The materials are not a substitute for obtaining professional advice from a qualified person, firm or corporation. Consult the appropriate professional advisor for more complete and current information. I am not engaged in rendering any legal or professional services by placing these general informational materials on this website.
I specifically disclaims any liability, whether based in contract, tort, strict liability or otherwise, for any direct, indirect, incidental, consequential, or special damages arising out of or in any way connected with access to or use of the site, even if I have been advised of the possibility of such damages, including liability in connection with mistakes or omissions in, or delays in transmission of, information to or from the user, interruptions in telecommunications connections to the site or viruses.
I make no representations or warranties about the accuracy or completeness of the information contained on this website. Any links provided to other server sites are offered as a matter of convenience and in no way are meant to imply that I endorse, sponsor, promote or am affiliated with the owners of or participants in those sites, or endorse any information contained on those sites, unless expressly stated.


Are you implying that GOOG is overpriced?
ReplyDeleteHi there... Not quite, I'm implying that the risk in the shares may be under priced. The risk in the shares is priced by the option market.
ReplyDelete