Sunday, November 24, 2013

Lumber Liquidators (LL) - The Finger Print of Fraud; Stock Gaps Down on Fraud Accusations; The "Expense Recognition" Game. Is Volatility Mis-priced?

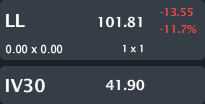
LL closed Friday trading at $101.81, tumbling down 11.7% with IV30™ popping 26.8%. The Symbol Summary is included below.


Provided by Livevol

Lumber Liquidators Holdings, Inc. (Lumber Liquidators) is retailer of hardwood flooring, and hardwood flooring enhancements and accessories. The Company offers an assortment of wood flooring, which includes prefinished domestic and exotic hardwoods, engineered hardwoods, unfinished hardwoods, bamboo, cork and laminates, as well as resilient flooring.


I found this stock looking for the day's largest losers, and as is usually the case, there's quite a story behind this drop.  The end results is both a stock and volatility story surrounding some scathing remarks made by a short-seller implicating management in multiple types of fraud.  Oh, and by the way, the stock was up more than 650% in two-years before this news.

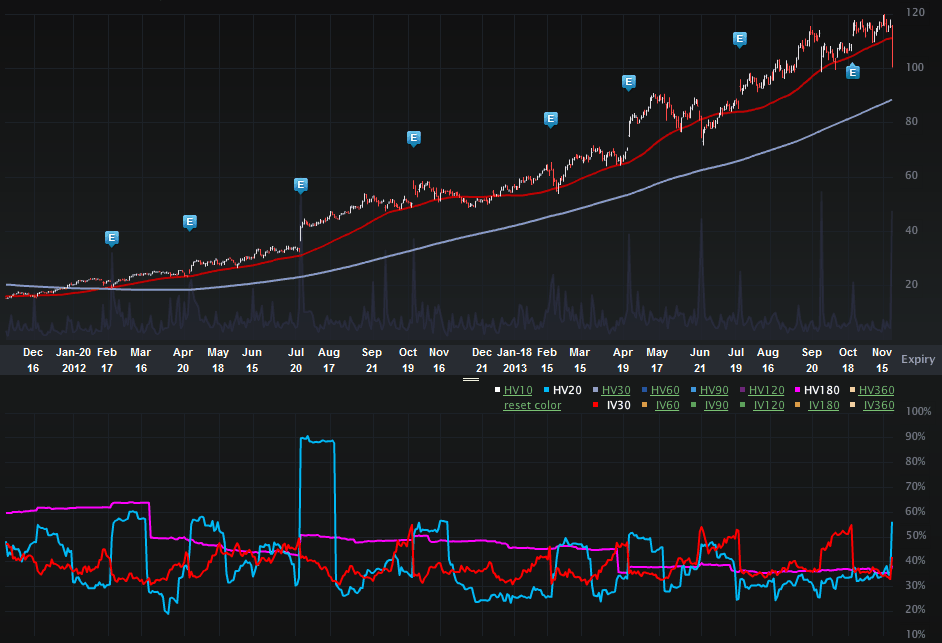
Let's start with the the two-year BLOX Charts Tab is included (below). The top portion is the stock price, the bottom is the vol (IV30™ - red vs HV20™ - blue vs HV180™ - pink).  Then get into the accusations and the volatility.
Provided by Livevol

On the stock side we can see a monumental appreciation following a frighteningly calm ascent.  The stock was trading at $15.29 two-years ago, and opened Friday at $115.36.  That's a 650% gain in two years on a surprisingly level headed upward trend that has turned a $420 million market cap company into one that was worth nearly $3.2 billion before Friday's drop.

Here's the news, and it is ugly:

---
Shares of Lumber Liquidators  were getting taken to the woodshed, falling 12% after Whitney Tilson, head of the Kase Capital Management hedge fund, announced a short position in the high-flying wood-flooring specialist. At an investor conference, Tilson noted a government investigation into potentially illegal timber imports by Lumber Liquidators, and suggested the company's gross margins, which have improved to better than 40% lately, were too good to be true. The hedge fund manager also cited a report from the non-profit Environmental Investigative Agency that said Lumber Liquidators' purchases "have fueled rampant illegal logging in Eastern Russia." Shares of the flooring retailer had more than doubled this year before today's drop, riding the broader housing recovery.

Source: The Motley Fool via Yahoo! Finance; Dow Hits Another Record, but Lumber Liquidators and Fresh Market Tumble, written by Jeremy Bowman.
---

I have added the italics and bold font to draw out the real news.

1. Kase Capital is shorting LL stock.
2. Whitney Tilson pointed out a government investigation into potentially illegal operations.
3. The gross margins for LL could be falsified.
4. Other potential shenanigans in Russia.

The accounting fraud game of expense recognition is often times seen in gross margins.  It can be done in several ways, but two of the most common are:

1. Blatant falsification of costs (under reporting).
2. Knowingly mis-classifying costs from COGS into SG&A and thus artificially boosting gross margins (operating revenue - COGS).

Either of these games is a major no-no, number one being worse than number two, but both, if true and discovered, likely result in an SEC Enforcement Action of Accounting Fraud.

Now remember, these are claims from a short-seller, not claims or actions from the regulators.  But, if there is an existing investigation, that means... there is a volatility story to be told.  So let's tell it.

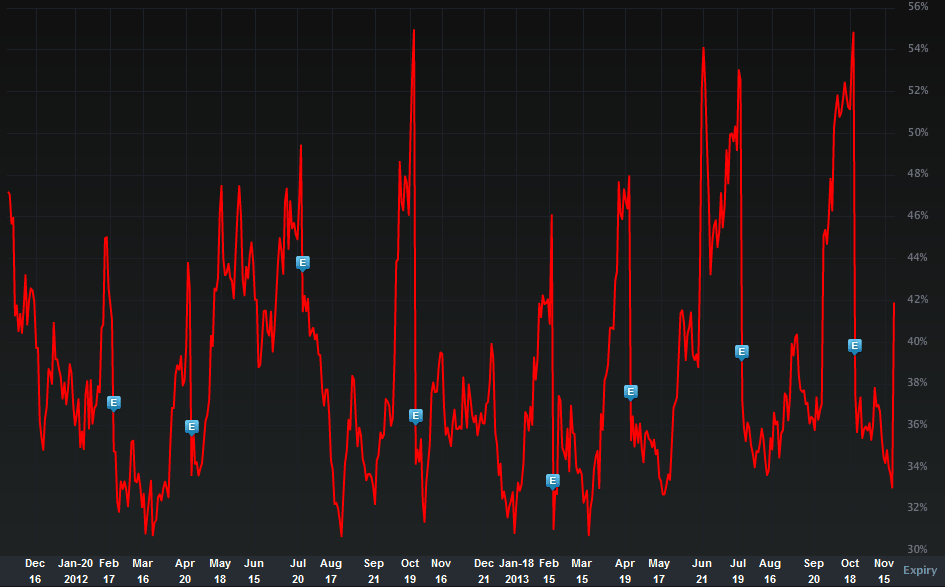
Let's turn to the two year IV30™ chart in isolation, below.
Provided by Livevol

We can see the spike from Friday's news, but still, that red line is kind of "middle-of-the-road" relative to the last two-years.  Here's my question: "If a stock is up 650% in two-years, has been accused openly by a short-seller of Accounting fraud while a government investigation appears to be open regarding shenanigans into operations of the firm and the stock gaps down on a reminder of that news, shouldn't volatility be elevated?"

I'll let you decide, but I can tell you that not only is the IV30™ in the 46th percentile on an annual level (so right about the middle), but the back month (Jan'14 options) show even lower volatility.  Huh?...

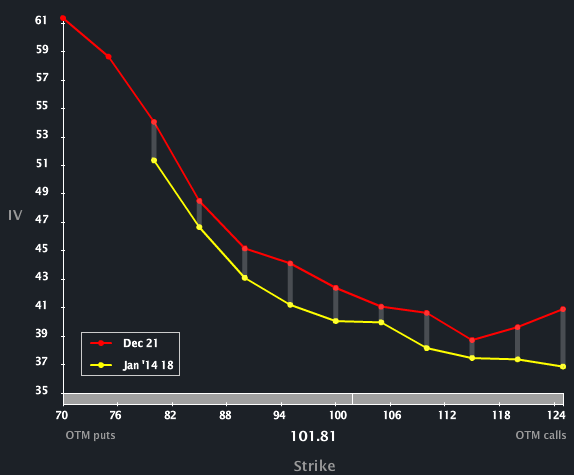
Let's turn to the Skew Tab, below.
Provided by Livevol

I use this image simply to show that Jan vol (the yellow curve) is lower than Dec vol (the red curve).  Why does the option market reflect less risk in Jan than Dec when Dec itself is tame if not low for the year?  It appears that the option market reflects that this news will pass relatively soon and relatively quietly.  Hmm...

To read more about skew, what is and why it exists you can click the title below:

Understanding Option Skew -- What it is and Why it Exists.

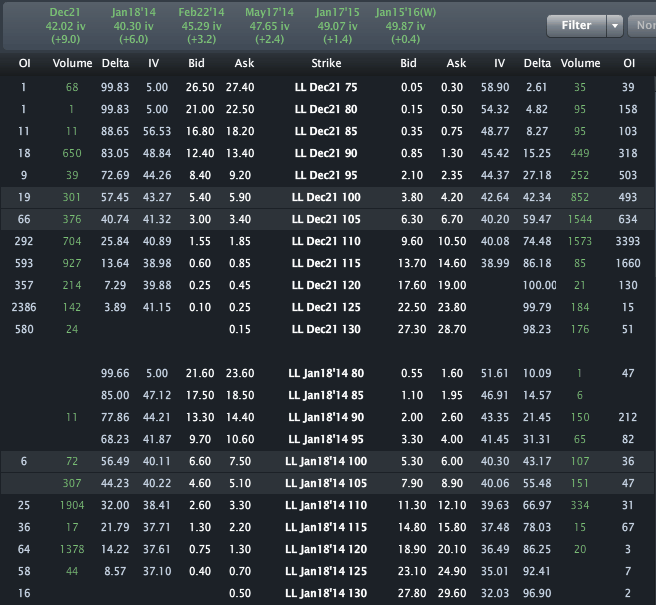
Finally, let's look to the Options Tab (below).
Provided by Livevol

Across the top we can see the monthly vols are priced to 42.02% for Dec and 40.30% for Jan, so the vol reflects lower risk in Jan.  I'd keep an eye on this one  I'm nit sure this was a one and done story.  Not for a stock that was up 650% and has multiple accusations of fraud and a government inquiry into operations.  I believe we would call that, "risk elevating" news.

This is trade analysis, not a recommendation.


Legal Stuff:
Options involve risk. Prior to buying or selling an option, an investor must receive a copy of Characteristics and Risks of Standardized Options. Investors need a broker to trade options, and must meet suitability requirements.

The information contained on this site is provided for general informational purposes, as a convenience to the readers. The materials are not a substitute for obtaining professional advice from a qualified person, firm or corporation. Consult the appropriate professional advisor for more complete and current information. I am not engaged in rendering any legal or professional services by placing these general informational materials on this website.

I specifically disclaims any liability, whether based in contract, tort, strict liability or otherwise, for any direct, indirect, incidental, consequential, or special damages arising out of or in any way connected with access to or use of the site, even if I have been advised of the possibility of such damages, including liability in connection with mistakes or omissions in, or delays in transmission of, information to or from the user, interruptions in telecommunications connections to the site or viruses.

I make no representations or warranties about the accuracy or completeness of the information contained on this website. Any links provided to other server sites are offered as a matter of convenience and in no way are meant to imply that I endorse, sponsor, promote or am affiliated with the owners of or participants in those sites, or endorse any information contained on those sites, unless expressly stated.

Tuesday, November 19, 2013

Infoblox (BLOX) - Volatility Explodes to All-time Highs; Stock Up 200% in a Year but Earnings Reflect Unprecedented Risk

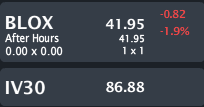
BLOX closed Tuesday trading at $41.95, down 1.9% with IV30™ rising again, this time to multi-year highs. The Symbol Summary is included below.


Provided by Livevol

Infoblox Inc. (Infoblox) is an automated network controller. The Company’s network functions include Internet protocol (IP) address management, device configuration, compliance, network discovery, policy implementation, security and monitoring.

I found this stock using a real-time custom scan. This one hunts for elevated vols.  I note that BLOX has earnings due out on 11-26-2013 AMC, and while this is probably a name you're not familiar with (I wasn't), this is a compelling stock and volatility story set up for earnings.

Custom Scan Details
Stock Price GTE $5
IV30™ GTE 30
IV30™ Percentile GTE 80
Average Option Volume GTE 1,200

The goal with this scan is to identify short-term implied vol (IV30™) that is elevated to its own annual history (at least in the 80th percentile). I'm also looking for a reasonable amount of liquidity in the options (thus the minimum average option volume), and I want a minimum vol level so I don't pick up any boring ETF’s (or whatever). The stock price requirement helps me identify names that have enough strike prices to trade or spread.

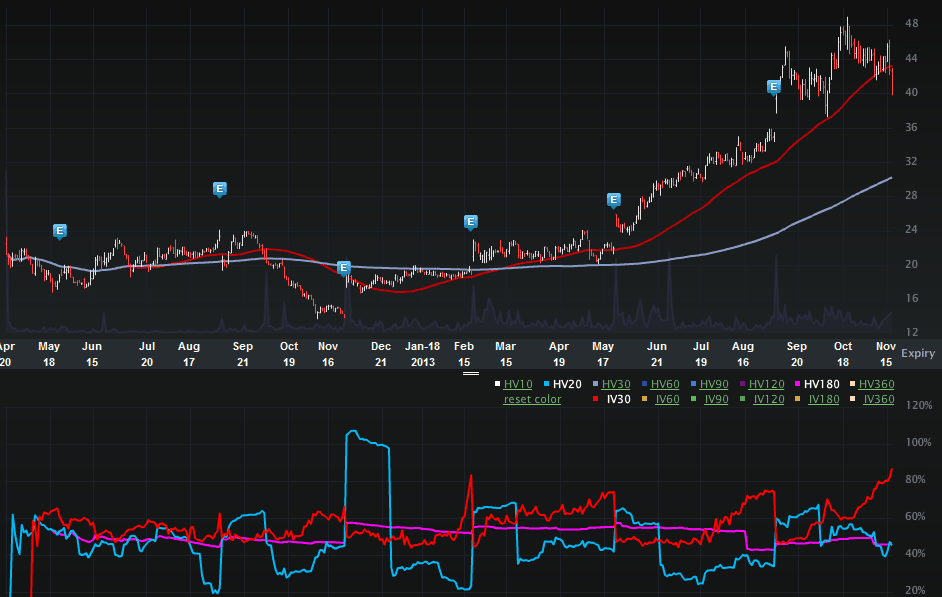
The two-year BLOX Charts Tab is included (below). The top portion is the stock price, the bottom is the vol (IV30™ - red vs HV20™ - blue vs HV180™ - pink).

Provided by Livevol

On the stock side we can see a rise starting from 11-29-2012 on a rip roaring move off of earnings taking the stock from $13.95 to $18.07 in a single day, or a 30% one-day rise.  Since then, the stock has risen as high as $48.97 and still sits 200% higher at the current level of $41.95.  In that time, the firm has gone from a kinda quiet small cap to a firm now worth nearly $2.2 billion.  Well done management...

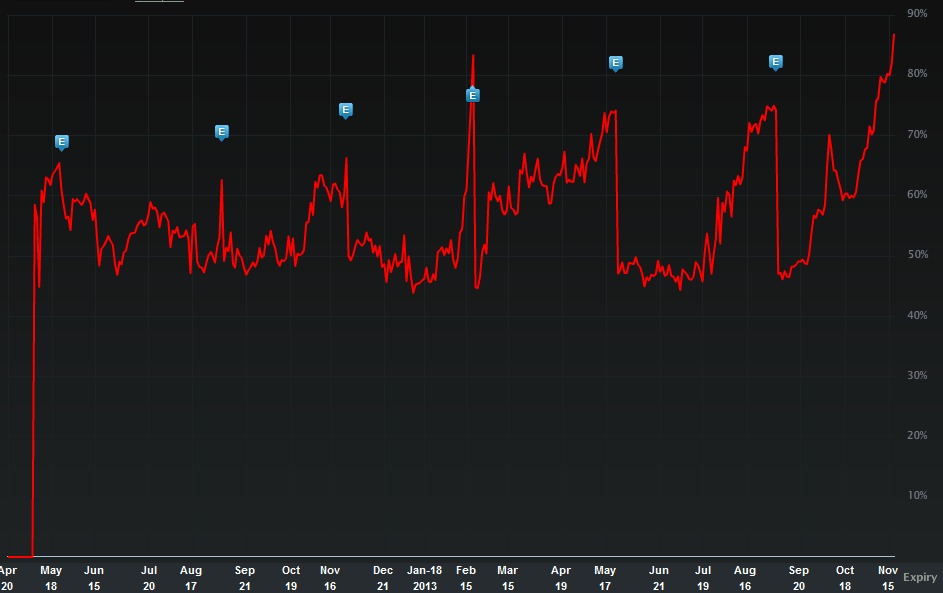
But, this is more than a stock story -- much more.  Let's turn to the two year IV30™ chart in isolation, below.

Provided by Livevol

Check out the recent rise.  Yes it's due to earnings, and yes the movement is similar to prior earnings dates (the blue "E" icons represent earnings releases), but the 86.88% level it closed at on Tuesday is way into multi-year (and all-time) high territory.  In fact, the peak prior to this run was 83.30% and that was a single day. 

Since earnings aren't due out for about a week, it's a distinct possibility if not probability that the implied will continue to rise into that event.  90%+ implied is not impossible.  This is turning into a compelling vol story in a stock that has totally transformed itself in terms of valuation.

Finally, let's look to the Options Tab (below).

Provided by Livevol

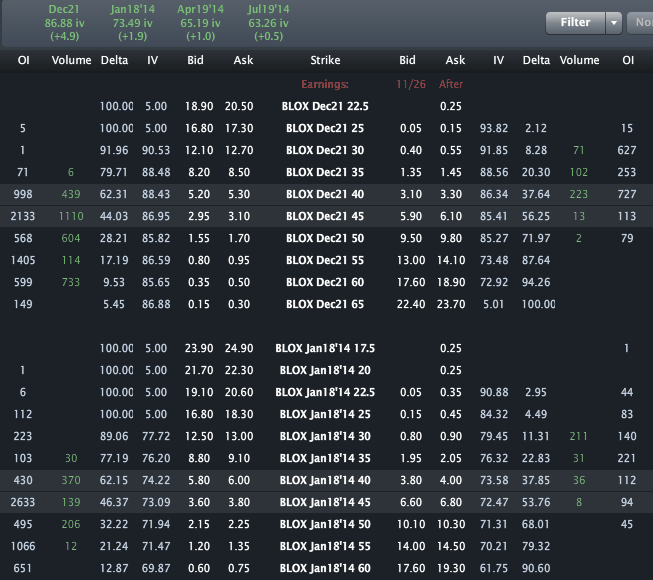
Across the top we can see the monthly vols are priced to 86.88% for Dec and 73.49% for Jan, so the vol reflects the risk in the earnings release.  I'd keep an eye on this one -- both the price and the risk.

This is trade analysis, not a recommendation.


Legal Stuff:
Options involve risk. Prior to buying or selling an option, an investor must receive a copy of Characteristics and Risks of Standardized Options. Investors need a broker to trade options, and must meet suitability requirements.

The information contained on this site is provided for general informational purposes, as a convenience to the readers. The materials are not a substitute for obtaining professional advice from a qualified person, firm or corporation. Consult the appropriate professional advisor for more complete and current information. I am not engaged in rendering any legal or professional services by placing these general informational materials on this website.

I specifically disclaims any liability, whether based in contract, tort, strict liability or otherwise, for any direct, indirect, incidental, consequential, or special damages arising out of or in any way connected with access to or use of the site, even if I have been advised of the possibility of such damages, including liability in connection with mistakes or omissions in, or delays in transmission of, information to or from the user, interruptions in telecommunications connections to the site or viruses.

I make no representations or warranties about the accuracy or completeness of the information contained on this website. Any links provided to other server sites are offered as a matter of convenience and in no way are meant to imply that I endorse, sponsor, promote or am affiliated with the owners of or participants in those sites, or endorse any information contained on those sites, unless expressly stated.
Monday, November 18, 2013

Tesla Motors (TSLA) - Stock Collapsing, Volatility Rising, but the Paradigm Has Not Shifted... Yet


TSLA is trading $124.76, down 7.9% with IV30™ up 15.7%. The Symbol Summary is included below.


Provided by Livevol

Tesla Motors, Inc. (Tesla) designs, develops, manufactures and sells electric vehicles and advanced electric vehicle powertrain components.

I have written about TSLA extensively, and have included the articles, below.  You can click on a title to read the posts.  I do note that walking into a TSLA dealership and speaking with a salesman (they are shareholders) has been a perfect indicator of earnings well ahead of anything Wall St. has projected.  Read the post from 8-8-2013) below for an actual real-time example.


11-6-2013: Tesla (TSLA) - Earnings Happened; Stock Falls Hard... But Do You Know The Facts About this Company?

Provided by Livevol

8-8-2013: Tesla (TSLA) - Now a $20B Firm Off of Earnings Blow Out; How Wall St. Absolutely Blew It; But I didn't... And I'm Just a Guy...


5-9-2013: Tesla (TSLA) - Earnings Explosion Spectacle Hides Vol Shift -- This is a New Company -- A Paradigm Shift is Complete


5-15-2013: Tesla (TSLA) - May Skew Stays Parabolic; Vol Diff Opens... And Some Stuff You May Not Have Known...


5-29-2013: Tesla (TSLA) - This is a New Company; The Paradigm Shift Continues; Part 3 of 3.


So we have seen a paradigm shift, a stock exploding and now imploding (sort of).  Let's take inventory of where we are right now.

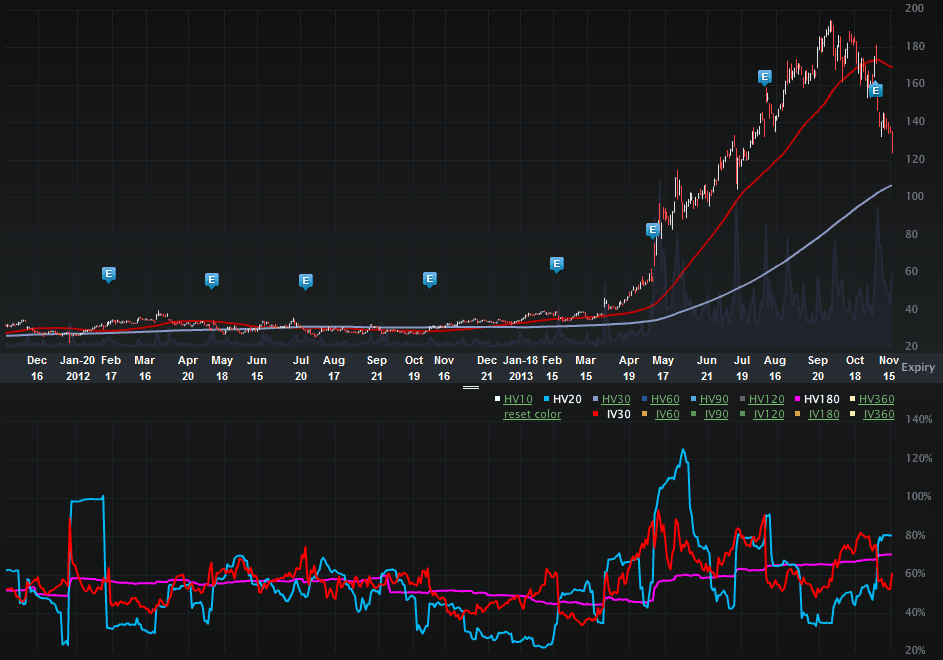
Let's start with the Charts Tab (two-years) below. The top portion is the stock price, the bottom is the vol (IV30™ - red vs HV20™ - blue vs HV180™ - pink).

Provided by Livevol

On the stock side we see price moving from ~$25 to $194.50 and now back down to $128. The stock has dropped nearly $70 since its intra-day high on 9-30-2013.  That's an abrupt move in about six weeks.  The downward momentum is evident today along with a volatility spike reflecting greater risk in the share price in the next 30-days.

What's the news today? Well, it's sort of a summary of what the issue has been since 9-30-2013:

---
Shares slumped Monday and showed little sign of stemming the downside momentum that has picked up steam over the past six weeks.

From car fires to a sour outlook to valuation concerns, the stock has lost more than 35% of its value since hitting a record high of $194.50 on Sept. 30.

Tesla shares on Monday fell more than 9% to $123.11, a four-month low. The stock is still up 265% this year despite the recent drop, although it had risen as much as 478%.

Last week at the DealBook conference, CEO Elon Musk tried to give assurances that there was no reason to recall the Model S despite three car fires that have prompted questions about the car’s safety.

He also addressed the company’s valuation, saying the high stock price has been a distraction and that the recent decline made the value a better deal for potential investors. His comments came after he said in October that the stock had “quite a high valuation, a higher valuation than we have any right to deserve.”

Source: The Wall St. Journal via Yahoo! Finance; Tesla Troubles Mount: Shares Tumble to Four-Month Low, written by Steven Russolillo.
---

There you have it. I wrote earlier this month:

---
11-6-2013
TSLA shares are down b/c while the demand for their product is high, they can't keep up with production.

That's it... They didn't hit some weird rumor numbers that were floating around the internet, but that's just... well, rumors and speculation. Now the stock did benefit from those rumors (maybe), and thus the stock drop could make sense. But let's not lose sight of the bigger picture:

This is a firm with demand outpacing production for a $70,000 - $100,000 per unit product.
---

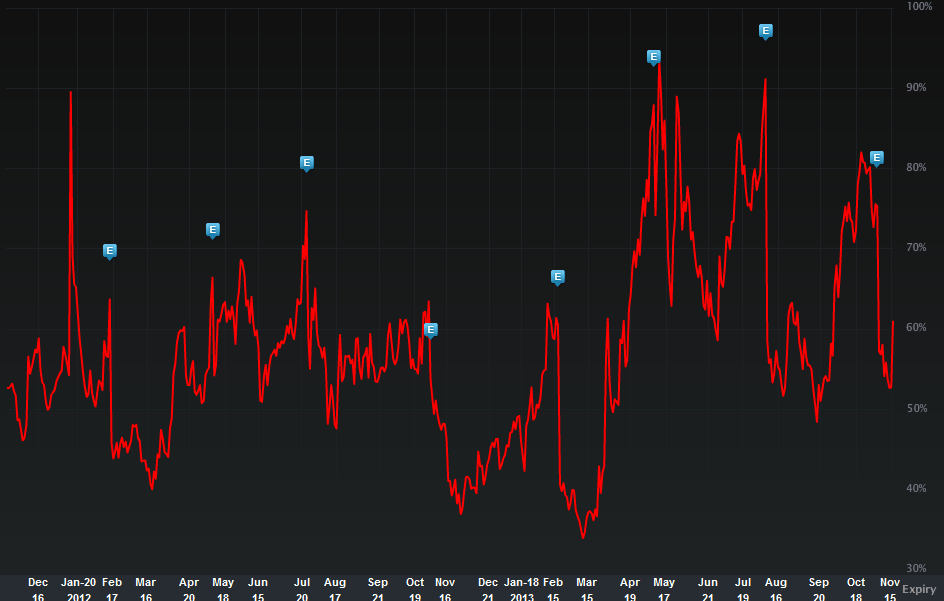
But I'm off that story and on to a volatility story. Let's look at the two year IV30™ chart in isolation, below.

Provided by Livevol

Note that during this stock drop the implied volatility has actually been falling.  That's very unusual and could be seen by some (like me) that the firm is in fact closer to "proper" valuation now than it was pre-stock collapse.

Here's the thing though, there is something in the Skew that changed a while ago and has NOT changed recently in TSLA and this is quite interesting.

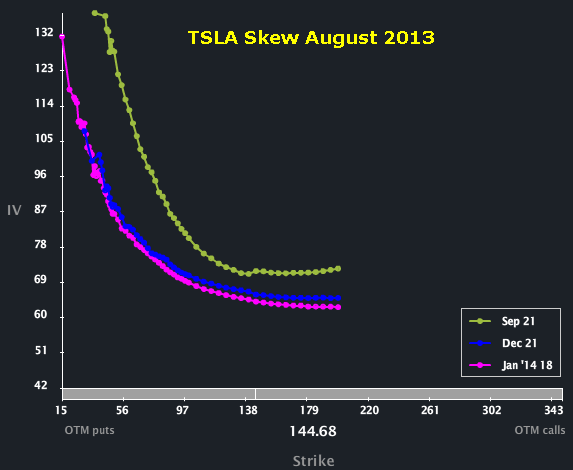
First, let's turn to the Skew Tab for TSLA in August of this year (2013).

Provided by Livevol

Note the skew shape across the front three months; it's "normal"  The Out-of-the-money (OTM) puts are priced to higher volatility than the at-the-money (ATM) option and the OTM calls.  To read more about skew, what is and why it exists you can click the title below:

Understanding Option Skew -- What it is and Why it Exists.

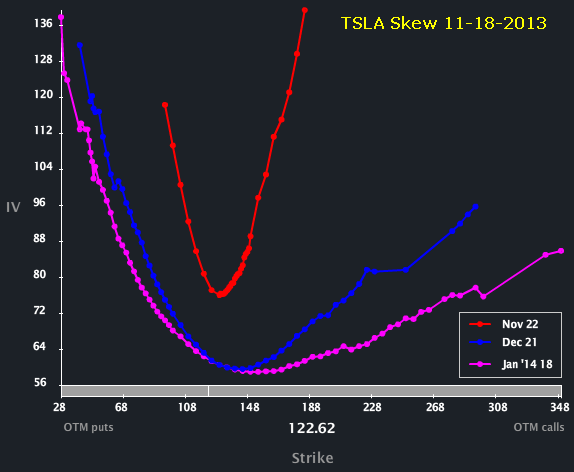
While TSLA had normal skew back then (with the stock price at $135), the skew shape shifted dramatically as the long interest grew.  Let's turn to the Skew Tab as of today, below.

Provided by Livevol

Now we can see a parabolic skew shape, which means that the option market reflects equally elevated risk to the upside and the downside.  So, while the stock has been collapsing, the option market still reads "upside has potential."  Watch this skew shape, if it turns back to the "old shape" (which is really a normal shape), then that would mean the option market no longer reflects that upside potential and that would in fact be a paradigm shift (again) for TSLA.

This is trade analysis, not a recommendation.


Legal Stuff:
Options involve risk. Prior to buying or selling an option, an investor must receive a copy of Characteristics and Risks of Standardized Options. Investors need a broker to trade options, and must meet suitability requirements.

The information contained on this site is provided for general informational purposes, as a convenience to the readers. The materials are not a substitute for obtaining professional advice from a qualified person, firm or corporation. Consult the appropriate professional advisor for more complete and current information. I am not engaged in rendering any legal or professional services by placing these general informational materials on this website.

I specifically disclaims any liability, whether based in contract, tort, strict liability or otherwise, for any direct, indirect, incidental, consequential, or special damages arising out of or in any way connected with access to or use of the site, even if I have been advised of the possibility of such damages, including liability in connection with mistakes or omissions in, or delays in transmission of, information to or from the user, interruptions in telecommunications connections to the site or viruses.

I make no representations or warranties about the accuracy or completeness of the information contained on this website. Any links provided to other server sites are offered as a matter of convenience and in no way are meant to imply that I endorse, sponsor, promote or am affiliated with the owners of or participants in those sites, or endorse any information contained on those sites, unless expressly stated.
Thursday, November 14, 2013

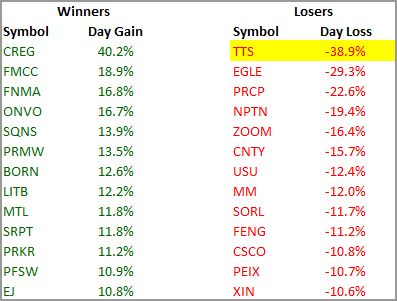
Largest Gainers and Losers


Provided by Livevol

To read the TTS blog, click on the title, below:
Tile Shop (TTS) - Stock Collapses on Fraud Accusations; But Order Flow May Be A Cheater of a Different Type... Fraud on a Fraud?


This is analysis, not a recommendation.


Legal Stuff:
Options involve risk. Prior to buying or selling an option, an investor must receive a copy of Characteristics and Risks of Standardized Options. Investors need a broker to trade options, and must meet suitability requirements.

The information contained on this site is provided for general informational purposes, as a convenience to the readers. The materials are not a substitute for obtaining professional advice from a qualified person, firm or corporation. Consult the appropriate professional advisor for more complete and current information. I am not engaged in rendering any legal or professional services by placing these general informational materials on this website.

I specifically disclaims any liability, whether based in contract, tort, strict liability or otherwise, for any direct, indirect, incidental, consequential, or special damages arising out of or in any way connected with access to or use of the site, even if I have been advised of the possibility of such damages, including liability in connection with mistakes or omissions in, or delays in transmission of, information to or from the user, interruptions in telecommunications connections to the site or viruses.

I make no representations or warranties about the accuracy or completeness of the information contained on this website. Any links provided to other server sites are offered as a matter of convenience and in no way are meant to imply that I endorse, sponsor, promote or am affiliated with the owners of or participants in those sites, or endorse any information contained on those sites, unless expressly stated.
Tile Shop (TTS) - Stock Collapses on Fraud Accusations; But Order Flow May Be A Cheater of a Different Type... Fraud on a Fraud?


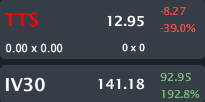
TTS halted trading at $12.95, down 39% with IV30™ exploding up 192.8%. The Symbol Summary is included below.


Provided by Livevol

Tile Shop Holdings, Inc. is a specialty retailer of manufactured and natural stone tiles, setting and maintenance materials, and related accessories in the United States.

This is an order flow note -- pre-event order flow that may have been based on private information.  First, obviously, there is some news today.  Here is a snippet:

---
Tile Shop plunges after short-seller claims profits overstated
Stone tile retailer Tile Shop Holdings (TTS) is tumbling after Gotham City Research alleged that the company has drastically overstated its profits. WHAT'S NEW: Tile Shop's 2013 earnings are overstated by over 200%, alleged Gotham City, a research firm that sells stock short. Moreover, Tile Shops' largest supplier, Beijing Pingxiu, is a related company and Tile Shop has not disclosed that relationship, according to Gotham City. The tile retailer's creditors probably won't grant it any more loans until its accounting errors are corrected, wrote the firm, which thinks Tile Shop's stock is worth just $1.54-$3.34 per share.

Source: TheFlyOnTheWall via Yahoo! Finance; Tile Shop plunges after short-seller claims profits overstated
---

That is scary stuff -- an accusation of outright fraud.  Unfortunately, there may be some fraud associate with the option trades prior to this news.  A fraud into a fraud?  Well, let's not get over excited, here are the facts.

First, the Stats Tab below illustrates that TTS averages 162 total puts traded per day over the last 90 days.


Provided by Livevol


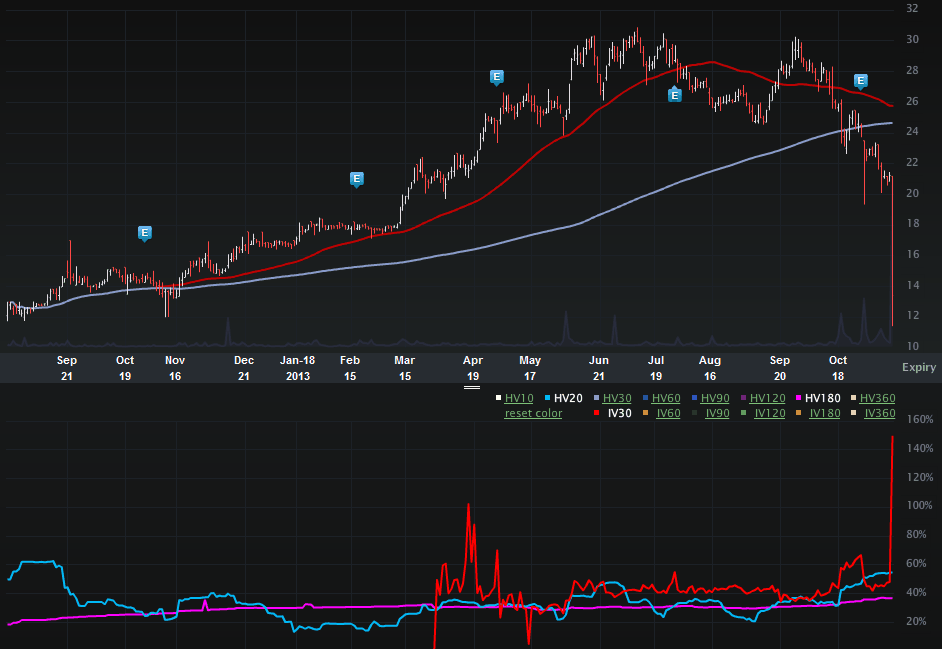
OK, next, let's look at the two-year Charts Tab, below. The top portion is the stock price, the bottom is the vol (IV30™ - red vs HV20™ - blue vs HV180™ - pink).

Provided by Livevol

We can see very easily that the stock has collapsed and the implied volatility is at totally unprecedented levels.  But that's not this story.  The story is pre-event order flow, so let's look at it remembering the average of 162 puts traded per day on average.

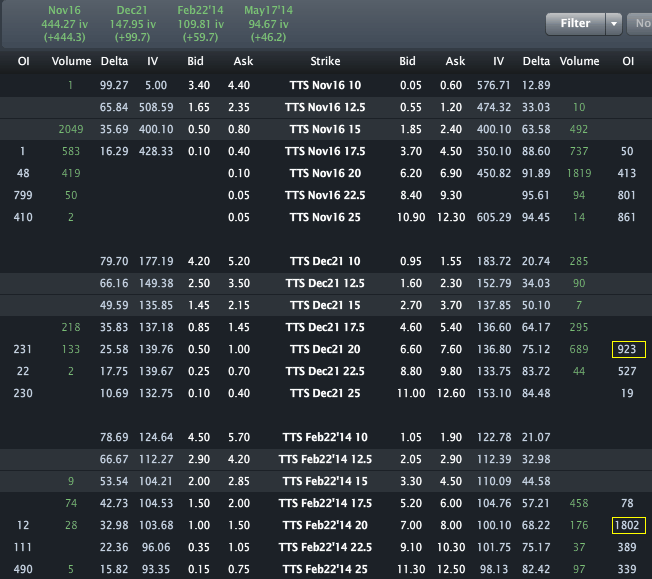
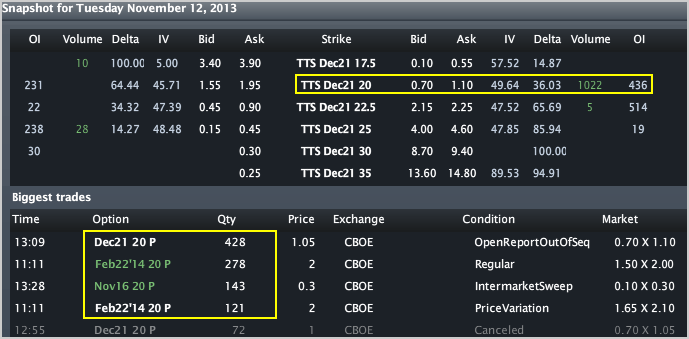
I have included the Options Tab from today, check out the open interest (OI) in the Dec 20 puts and the Feb 20 puts (highlighted in yellow).

Provided by Livevol

Note that the Dec 20 puts are now worth ~$7.00 and the Feb 20 puts are now worth ~$7.50.  So what?...  Here's what...

Check out the Options Montage and days largest trades from 11-12-2013, below.

Provided by Livevol

The volume in the Dec 20 puts was 1,022 (again, the total daily average volume in puts is 162).  And, though not pictured, the volume in the Feb 20 puts was 522 on an OI of 1312.  That OI rose the next day to 1,802 (which is where it sits today).

We can see the trades at the bottom of the image above -- The Dec 20 and Feb 20 puts are purchases for $1.05 and $2.00, respectively.  Further, the OI in the Feb 20 puts looks like this, by date:

11-6-2013: 155
11-7-2013: 1,040
11-12-2013: 1,312
11-14-2013: 1,802

Don't be fooled by some of the trades.  they look to the casual observer to be on the bid and therefore sales, but they are not.  Someone bid those options to $1.20 when the NBBO was $0.95 x $1.25.  that bid was hit, but that means the trade was buyer initiated.  very much the finger print of a professional trader hiding order flow (or from a less improprietous perspective, just a trader looking for a discount on some puts).

So what do we have?

A firm that averages 162 puts traded a day saw 1,488 trade on 11-14 with a large accumulation prior to that in the Feb 20 puts.  And what was the stock price when the trades happened?... How about $23...

The stock price now... How about $12.95 and halted.

This is trade analysis, not a recommendation.


Legal Stuff:
Options involve risk. Prior to buying or selling an option, an investor must receive a copy of Characteristics and Risks of Standardized Options. Investors need a broker to trade options, and must meet suitability requirements.

The information contained on this site is provided for general informational purposes, as a convenience to the readers. The materials are not a substitute for obtaining professional advice from a qualified person, firm or corporation. Consult the appropriate professional advisor for more complete and current information. I am not engaged in rendering any legal or professional services by placing these general informational materials on this website.

I specifically disclaims any liability, whether based in contract, tort, strict liability or otherwise, for any direct, indirect, incidental, consequential, or special damages arising out of or in any way connected with access to or use of the site, even if I have been advised of the possibility of such damages, including liability in connection with mistakes or omissions in, or delays in transmission of, information to or from the user, interruptions in telecommunications connections to the site or viruses.

I make no representations or warranties about the accuracy or completeness of the information contained on this website. Any links provided to other server sites are offered as a matter of convenience and in no way are meant to imply that I endorse, sponsor, promote or am affiliated with the owners of or participants in those sites, or endorse any information contained on those sites, unless expressly stated.
Wednesday, November 13, 2013

Boeing (BA) - Did You Know BA Returned 100% in Two-years and Risk Adjusted Smashed the S&P 500? Check This Out...

This article was posted: Wednesday, November 13, 2013

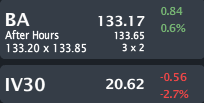
BA closed Wednesday trading at $133.17, up 0.6%, with IV30™ down 2.7%. The Symbol Summary is included below.


Provided by Livevol

The Boeing Company (Boeing) is an aerospace company. The Company operates in five segments: Commercial Airplanes, Boeing Military Aircraft (BMA), Network & Space Systems (N&SS), Global Services & Support (GS&S) and Boeing Capital Corporation (BCC).

This is actually a very short note simply to alert everyone, including myself, that this big boring airplane / defense firm has returned over 100% over the last two years and has more big news coming out.  I'll compare the risk return profile to the S&P 500, and eyes will pop, I'm guessing... mine did...

 Here's a snippet from an article today:

---
DUBAI/PARIS (Reuters) - Boeing (BA) looks set to dominate next week's Dubai Airshow with more than $100 billion of deals as it aims to launch its latest long-haul jet with up to 250 potential orders from as many as five airlines, industry sources said.

The U.S. planemaker is pressing ahead with the launch of its 777X mini-jumbo despite uncertainty over where it will be made, with workers at the existing 777 plant outside Seattle holding a ballot over a new employment contract on Wednesday.

Bulging civil and military bank balances in the Gulf remain a magnet for Western aerospace executives as they seek to tap thriving demand for jetliners and combat aircraft that offer some respite from defence cuts at home.defense

A widely expected potential order for as many as 150 of the new 777X passenger jets from Dubai flag carrier Emirates (EMIRA.UL) could come close to matching the $62 billion of deals amassed at the last Dubai show two years ago.

"Dubai's success is related to its airlines. It's a global hub now and Dubai did this by buying planes and constantly renewing its fleet," said John Sfakianakis, chief investment strategist at Riyadh-based asset management firm Masic.

"Abu Dhabi, Qatar and Saudi Arabia are also investing billions in aviation to be able to connect to the world. These states have to continue to invest if they want to expand."

Source: Reuters via Yahoo! Finance $100 billion Boeing order bonanza to dominate Dubai show, written by Praveen Menon and Tim Hepher.
---

Wow...

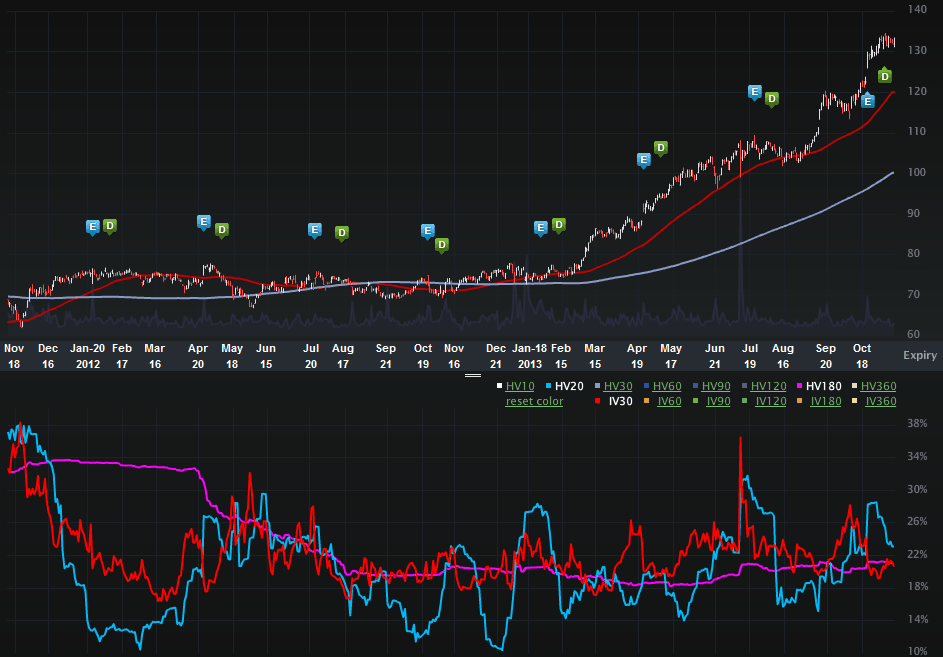
Let's quickly tun to the Charts Tab (two-years) below. The top portion is the stock price, the bottom is the vol (IV30™ - red vs HV20™ - blue vs HV180™ - pink).

Provided by Livevol

Look at that stock chart.  We can see that over this two-year period BA is actually up 100% (or ~$50 billion in market cap).  And what else do you get with BA?... how about historical realized volatilities of:

HV10™: 15.05%
HV20™: 23.08%
HV30™: 24.62%
HV60™: 21.66%
HV180™: 21.01%

A 100% return with a standard deviation of returns of 21.01% leaves an information ratio (IR) of ~ 4.8 (just divide the two numbers).  The S&P 500 over this time period:

Return: 42%
HV180™: 11.39%

That's an IR of 3.72 (BA was 4.8).

Here's a stock chart comparing the two (BA in yellow, SPX in red):

Provided by Livevol


Is BA still a big boring airplane / defense firm or a ridiculously good investment over the last two-years?  The future, no idea. The past, we have an idea...

This is trade analysis, not a recommendation.


Legal Stuff:
Options involve risk. Prior to buying or selling an option, an investor must receive a copy of Characteristics and Risks of Standardized Options. Investors need a broker to trade options, and must meet suitability requirements.

The information contained on this site is provided for general informational purposes, as a convenience to the readers. The materials are not a substitute for obtaining professional advice from a qualified person, firm or corporation. Consult the appropriate professional advisor for more complete and current information. I am not engaged in rendering any legal or professional services by placing these general informational materials on this website.

I specifically disclaims any liability, whether based in contract, tort, strict liability or otherwise, for any direct, indirect, incidental, consequential, or special damages arising out of or in any way connected with access to or use of the site, even if I have been advised of the possibility of such damages, including liability in connection with mistakes or omissions in, or delays in transmission of, information to or from the user, interruptions in telecommunications connections to the site or viruses.

I make no representations or warranties about the accuracy or completeness of the information contained on this website. Any links provided to other server sites are offered as a matter of convenience and in no way are meant to imply that I endorse, sponsor, promote or am affiliated with the owners of or participants in those sites, or endorse any information contained on those sites, unless expressly stated.
Crocs (CROX) - Stock Pops Volatility Explodes on News that Company Looks to Go Private

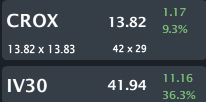
CROX is trading $13.82, up 9.3% with IV30™ exploding up 36.3%. The Symbol Summary is included below.


Provided by Livevol

Crocs, Inc is a designer, manufacturer and distributor of footwear and accessories for men, women and children. As of December 31, 2012, the Company sold its products in more than 90 countries through domestic and international retailers and distributors and directly to end-user consumers through its Company-operated retail stores, outlets, kiosks and Webstores.

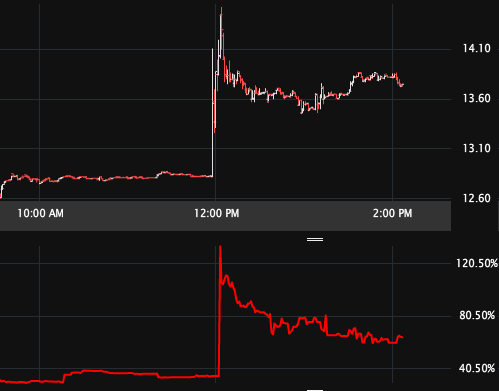
This is a vol and stock note on the day.  CROX spiked mid-day both in price and volatility, it seems to have stemmed from a note that CROX is considering going private.  I have included the tick chart below -- the top portion is the stock price, the bottom is the implied volatility for the Nov options.


Provided by Livevol

We can see how the price spiked and the Nov (three day options) volatility went from ~34% to ~ 134% in one minute. Whoa...

I found this stock using a real-time custom scan. This one hunts for vol gainers on the day.

Custom Scan Details
Stock Price GTE $5
IV30™ GTE 30
IV30™ Percent Change GTE 10
Average Option Volume GTE 1,200
IV30™ Change GTE 7

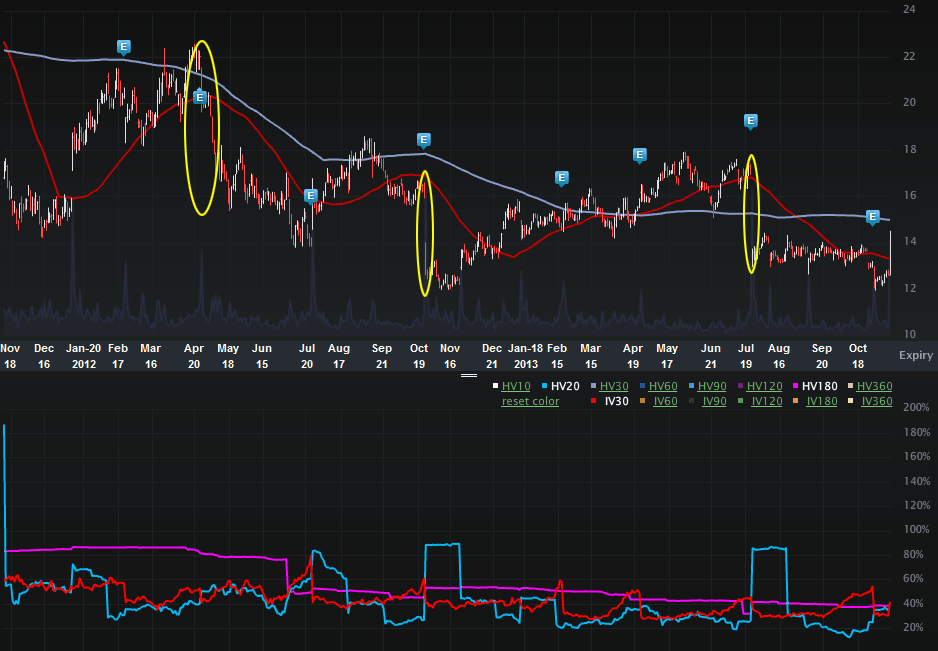
Let's turn to the two-year CROX Charts Tab. The top portion is the stock price, the bottom is the vol (IV30™ - red vs HV20™ - blue vs HV180™ - pink).

Provided by Livevol

It's the stock side that has the most information, namely it's been going down.  Check out the gaps in those three earnings releases I have highlighted (the blue "E" icon represents the earnings date).  Before today, the stock was trading near multi-year lows.  So what?.  Well, the market seems to reflect that if the stock does go private, the buyout price for shareholders will be a premium to that low price.

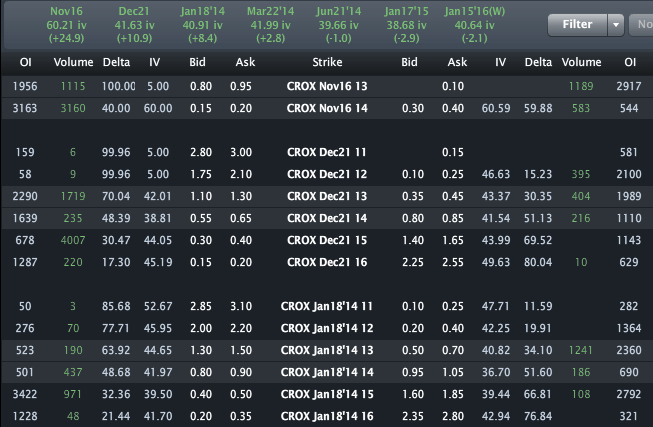
Finally, let's look to the Options Tab (below).

Provided by Livevol

Across the top we can see the monthly vols are priced to 60.21% for Nov (up 24.9 vol points) and 41.63% for Dec (up 10.9 vol points).  While the stock is up, it's tempered -- off of the highs of the day.  This will be an interesting one to watch as these news snippets (even if they prove to be true in outcome) discuss events that a long time to finalize (see DELL).  So, "should" the volatility be elevated in the near-term... I guess we'll see...

This is trade analysis, not a recommendation.


Legal Stuff:
Options involve risk. Prior to buying or selling an option, an investor must receive a copy of Characteristics and Risks of Standardized Options. Investors need a broker to trade options, and must meet suitability requirements.

The information contained on this site is provided for general informational purposes, as a convenience to the readers. The materials are not a substitute for obtaining professional advice from a qualified person, firm or corporation. Consult the appropriate professional advisor for more complete and current information. I am not engaged in rendering any legal or professional services by placing these general informational materials on this website.

I specifically disclaims any liability, whether based in contract, tort, strict liability or otherwise, for any direct, indirect, incidental, consequential, or special damages arising out of or in any way connected with access to or use of the site, even if I have been advised of the possibility of such damages, including liability in connection with mistakes or omissions in, or delays in transmission of, information to or from the user, interruptions in telecommunications connections to the site or viruses.

I make no representations or warranties about the accuracy or completeness of the information contained on this website. Any links provided to other server sites are offered as a matter of convenience and in no way are meant to imply that I endorse, sponsor, promote or am affiliated with the owners of or participants in those sites, or endorse any information contained on those sites, unless expressly stated.
Monday, November 11, 2013

Yum! Brands (YUM) - Volatility Rises with Stock; Calendar Diff Opens for Next 4 Days


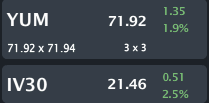
YUM is trading $71.92, up 1.9% with IV30™ up 2.5%. The Symbol Summary is included below.


Provided by Livevol

Yum! Brands, Inc. (YUM) is a quick service restaurant company based on number of system units, with approximately 37,000 units in more than 120 countries and territories. The Company through its three concepts of KFC, Pizza Hut and Taco Bell (the Concepts), develops, operates, franchises and licenses a worldwide system of restaurants, which prepare, package and sell a menu of priced food items. Units are operated by a Concept or by independent franchisees or licensees under the terms of franchise or license agreements.

The stock just came up on a real-time custom scan. This one hunts for calendar spreads between the front two months. And while Nov expiry is just days away, this vol diff opened up today and is worth a look.

Custom Scan Details
Stock Price GTE $5
Sigma1 - Sigma2 GTE 8
Average Option Volume GTE 1,000
Industry isNot Bio-tech
Days After Earnings GTE 5 LTE 70
Sigma1, Sigma2 GTE 1

The goal with this scan is to identify back months that are cheaper than the front by at least 8 vol points. I'm also looking for a reasonable amount of liquidity in the options (thus the minimum average option volume), want to avoid bio-techs (and their crazy vol) and make sure I'm not selling elevated front month vol simply because earnings are approaching.

Let's start with the Skew Tab, below.

Provided by Livevol

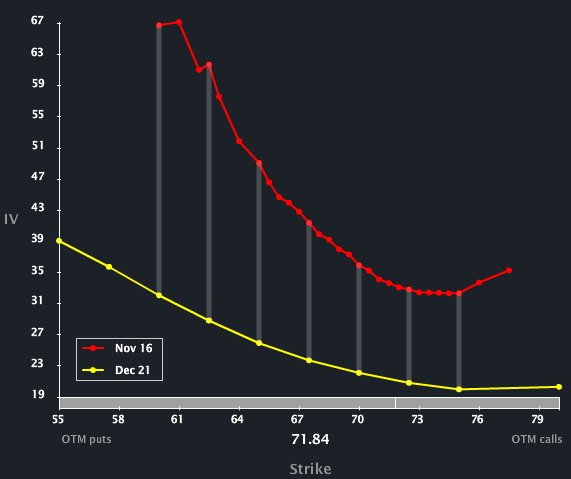
We can see two phenomena here:
1. The red curve (Nov option volatility) is above the yellow curve (Dec option volatility) for all strike prices.

2. The red curve (Nov options) shows a distinct bend to the downside, which means the out-of-the-money puts (OTM) are priced higher than the at-the-money (ATM) options and the OTM calls.  There's also a small upside bend to the OTM calls.  In English, the option market reflects a higher likelihood of both an upside or downside move in YUM stock price in the near-term (the next four calendar days) than it does in the medium-term (December expiration).

To read about option skew, what it is and why it exists, you can read the post below by clicking on the title:

Understanding Option Skew -- What it is and Why it Exists

Now we can turn to the two-year Charts Tab (below). The top portion is the stock price, the bottom is the vol (IV30™ - red vs HV20™ - blue vs HV180™ - pink).

Provided by Livevol

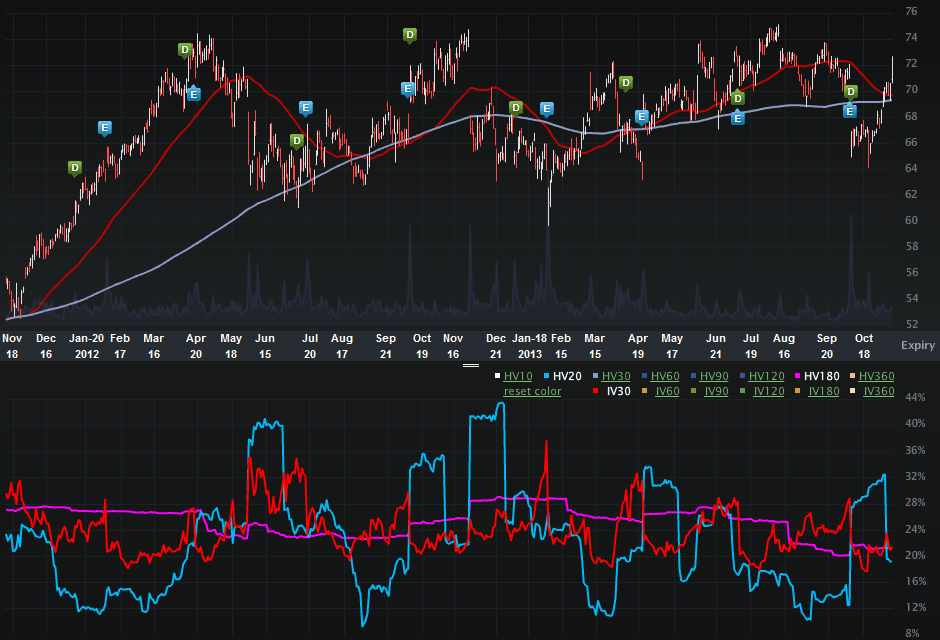
On the stock side we can see a nice appreciation from the low $50's to now over $70.  Looking a bit more myopically we can see YUM stock rise from $66.48 on 10-9-2013 off of a disappointing earnings release (the blue "E" icon represents an earnings date) back to $71.92 in about a month.  So, the stock has recovered to pre-earnings levels. 

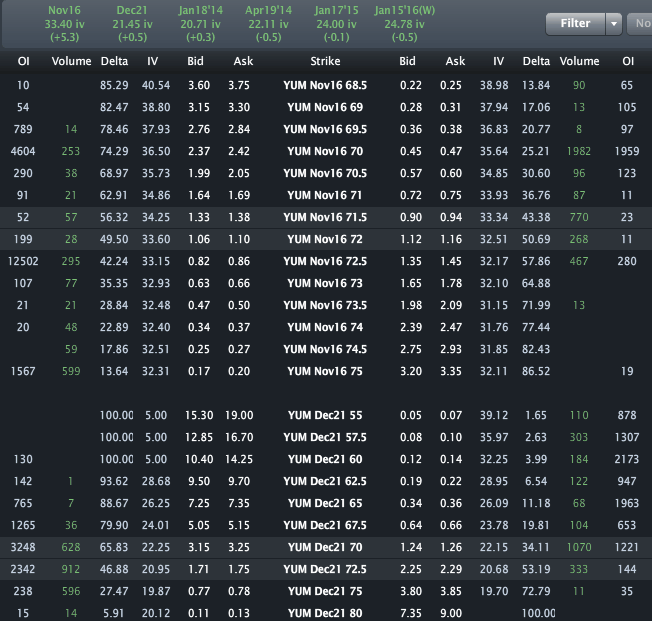
What's interesting about today is that while the stock is up, the implied volatility is up too.  Further, the IV move in Nov is substantially larger than Dec (which we'll see below), and that difference has created a wider time spread.

Finally, let's look to the Options Tab (below).

Provided by Livevol

Across the top we can see the monthly vols are priced to 33.40% for Nov and 21.45% for Dec.  Also note the little green numbers in parenthesis below the monthly vols numbers -- Nov is up 5.3 volatility points today while Dec is up just 0.5 volatility points.  The end result is that calendar spread we see in the Skew Tab. This has certainly turned into a compelling short-term volatility phenomenon.

This is trade analysis, not a recommendation.


Legal Stuff:
Options involve risk. Prior to buying or selling an option, an investor must receive a copy of Characteristics and Risks of Standardized Options. Investors need a broker to trade options, and must meet suitability requirements.

The information contained on this site is provided for general informational purposes, as a convenience to the readers. The materials are not a substitute for obtaining professional advice from a qualified person, firm or corporation. Consult the appropriate professional advisor for more complete and current information. I am not engaged in rendering any legal or professional services by placing these general informational materials on this website.

I specifically disclaims any liability, whether based in contract, tort, strict liability or otherwise, for any direct, indirect, incidental, consequential, or special damages arising out of or in any way connected with access to or use of the site, even if I have been advised of the possibility of such damages, including liability in connection with mistakes or omissions in, or delays in transmission of, information to or from the user, interruptions in telecommunications connections to the site or viruses.

I make no representations or warranties about the accuracy or completeness of the information contained on this website. Any links provided to other server sites are offered as a matter of convenience and in no way are meant to imply that I endorse, sponsor, promote or am affiliated with the owners of or participants in those sites, or endorse any information contained on those sites, unless expressly stated.

Saturday, November 9, 2013

Part 3 of 3: Skew Shifts on Takeover Rumors

This was originally posted on Wednesday, September 7, 2011 and is now a case study in a three part series on option skew. You can read parts one and two by clicking on the titles below.

Part1: Understanding Option Skew -- What it is and Why it Exists

Part2: Trading Option Skew

VRSN is trading $34.76, up 8.4% with IV30™ up 5.2%. The LIVEVOL® Pro Summary is below.


VeriSign, Inc. is a provider of Internet infrastructure services. It provides domain name registry services and infrastructure assurance services.

The stock has been popping of late on takeover spec. Here's a quick news snippet from Forbes.com written by Eric Savitz.

---
VeriSign shares are trading sharply higher for a second straight session after the company cancelled an appearance yesterday at a Citigroup technology conference.

ThinkEquity analyst Daniel Cummins reports in a research note that the company also cancelled a planned presentation at a technology conference his own firm is holding next week.

Cummins says he thinks the cancellations likely have more to do with the company’s CEO search than to potential M&A developments. He points out that the company since August has been run by Chairman and co-founder Jim Bidzos, who took over after former CEO Mark McLaughlin left to take the top job at Palo Alto Networks.

On the other hand, he also contends the company could make a good acquisition target.
Source: Forbes.com -- Update: VeriSign Rally Extends As Rumor Mill Heats Up
---

Well there you go. Takeover... Rumor... Again...

Let's turn to the Skew Tab and check out what is a very cool term structure and skew.


We can see a marked upside bid skew in Sep as the takeover rumors have pushed vol (and the stock) in the OTM calls. I've included the Skew Tab snap from 9-2-2011, below.


Awesome skew shape transformation. We can also see, when comparing the two time periods, how large a vol diff has opened up between the front month and the back two. Specifically, the Sep 36.25 calls are priced to 74 vol while the Oct 36 calls are priced to 47 vol. Said differently, Sep is 57% more expensive (in terms of vol) than Oct, and we're actually comparing a further OTM call in Sep.

Now we can turn to the Charts Tab (below). The top portion is the stock price, the bottom is the vol (IV30™ - red vs HV20 - blue vs HV180 - pink).


We can see the stock rise of late. On 9-2-2011, VRSN closed at $30.01. As of this writing, it's up nearly $5 or 16%. On the vol side we can see that the short-term historical has been trading above the implied for a few weeks -- starting with the stock drop in early Aug. The short-term implieds and historicals are all sort of converging at around 50 while the long-term realized trend is substantially lower. Specifically:

IV30™: 50.74
HV20: 53.35
HV10: 47.86
HV180: 27.19

Finally, let's look to the Options Tab (below).


This is trade analysis, not a recommendation.


Legal Stuff:
Options involve risk. Prior to buying or selling an option, an investor must receive a copy of Characteristics and Risks of Standardized Options. Investors need a broker to trade options, and must meet suitability requirements.

The information contained on this site is provided for general informational purposes, as a convenience to the readers. The materials are not a substitute for obtaining professional advice from a qualified person, firm or corporation. Consult the appropriate professional advisor for more complete and current information. I am not engaged in rendering any legal or professional services by placing these general informational materials on this website.

I specifically disclaims any liability, whether based in contract, tort, strict liability or otherwise, for any direct, indirect, incidental, consequential, or special damages arising out of or in any way connected with access to or use of the site, even if I have been advised of the possibility of such damages, including liability in connection with mistakes or omissions in, or delays in transmission of, information to or from the user, interruptions in telecommunications connections to the site or viruses.

I make no representations or warranties about the accuracy or completeness of the information contained on this website. Any links provided to other server sites are offered as a matter of convenience and in no way are meant to imply that I endorse, sponsor, promote or am affiliated with the owners of or participants in those sites, or endorse any information contained on those sites, unless expressly stated.

Friday, November 8, 2013

We Are in a Stock Market Bubble; We Are NOT in a Stock Market Bubble. You Decide.


The US markets are up again today and the VIX is down, adding to a remarkable year of positive stock returns and reduced implied risk. The Indices snapshot is included below.


Provided by Livevol

The question I'd like to address in this note is whether or not we are in a stock market "bubble."  Of course, you know before even reading the rest of this post that I don't know.  But, I'm going to provide some pretty strong arguments that we are and that we are not.

Let's start simply with facts.  I have included the annual charts for the NASDAQ and S&P 500, below.

Provided by Livevol

We can see greater than a 35% return in NASDAQ and nearly 30% in the S&P 500.  So, bubble or not, the market is up huge this year. I have included the annual returns for the S&P 500 index since 1980, below.


Source: http://www.1stock1.com/1stock1_141.htm

I have marked in green 1995 and 1997, the only two years in the last 33 years that have seen higher returns in the S&P, although this year very well may surpass both of those years when all is said and done. I also note that for both of those years (1995 and 1997), the market was up huge again the following here.

Finally, I have included a two-year return chart of the VIX spot, below.

Provided by Livevol

We can see that the VIX (the "fear index") is down ~65% over the last two-years.  So, either complacency has set in, or, we are literally in a less volatile (less risk) period.

OK, those are the facts, let's get into bubble arguments (pro and con).

Argument: We are in a bubble
Below I have included several snippets from articles that point to a conclusion that the market in general and the technology sector in even greater specificity is in a bubble.

---

Source: TheStreet.com via Yahoo! Finance; Fed-Induced Equity Bubbles Appear Ready to Pop, written by By Richard Suttmeier.

NEW YORK (TheStreet) -- [] The Dow Industrial Average set a new all-time high at 15,797.68 yesterday, which followed a new all-time high for the Dow transportation average set at 7131.80 on Monday. The latest all-time high for the S&P 500 was set at 1775.22 on Oct. 30 with the Russell 2000 matching that feat on the same day with an all-time high at 1123.26. The Nasdaq set its latest multi-year high at 3966.71 also on Oct. 30.

[] [T]he ValuEngine valuation warning reached its severest 2013 levels on Nov. 6 when 83.3% of all stocks were overvalued, with 53.3% overvalued by 20% or more. This was partially caused by the rise in the yield of the 30-year Treasury bond to 3.75%.

[] Note that 15 of 16 sectors were overvalued by double-digit percentages. We showed that 12 sectors were overvalued by 21.6% to 28.1%. The year to date gains are indeed impressive as are the gains over the last 12 months, but note that the P/E ratios are extremely elevated between 17.12 and 30.66.

After monthly benchmark revisions to ValuEngine data two interesting changes have occurred this morning. All 16 sectors are now overvalued as the basic materials sector shifted to 6.65% overvalued from 3.67% undervalued. The most overvalued sector is now multi-sector conglomerates at 31.07% overvalued vs. 25.47% on Nov. 6.
---

The title of the article certainly summarizes the position argued.  Certainly it is a fact that the S&P 500 and Dow Jones Industrial Average are at all-time highs. No argument there.

Key phrases from above:
"83.3% of all stocks were overvalued."
"All 16 sectors are now overvalued."


But, there's more... a lot more...

---
Source: Business Insider via Yahoo! Finance; Here's The Evidence That The Tech Sector Is In A Massive Bubble, written by Jim Edwards.

Here's the evidence that we're in a new tech bubble, heading for a crash, just like the dot com bust of 1999.


Fred / Think Progress

Before we get into specific evidence that the tech sector is inflated, it's worth restating the macro-economic context: Interest rates are basically at zero and have been for some time. When borrowers are paying close to zero interest on loans, that makes money cheap to get. This chart shows the Fed's target rate for interest since 1970.

The stock market is at a peak, which is exactly what you'd expect in a zero-interest environment.


Yahoo Finance / Jim Edwards

We've had five years of solid growth in stocks. People who have invested in stocks in the last five years now feel very, very rich. What could possibly go wrong?

[]

High stock prices and corporate giants who are rich with cash and need to invest it, PwC says. It's not just tech asset prices that are high. Salaries are high, too.
While unemployment generally may be high, in the tech sector it is very low.

Tech companies, led by Mark Zuckerberg at Facebook, are lobbying Congress to relax immigration rules so they can hire more foreign talent because they believe domestic talent has gotten too scarce and too expensive. It's driving up wages bills like crazy. Matt Allen, a tech recruiter at Vertical Move, told me recently:

We're experiencing first hand greater insanity than the dot-com days when Interwoven Software was pulling out BMW Z3's for engineers who joined. Instead, we're seeing sign-on bonuses for individuals five-years out of school in the $60,000 range. Candidates queuing-up six, eight or more offers and haggling over a few thousand-dollar differences among the offers. Engineers accepting offers and then fifteen minutes before they're supposed to start on a Monday, emailing (not calling) to explain they found something better elsewhere.

[See article for several specific examples]

Timothy Draper is the founder of Draper Fisher Jurvetson, a venture capital outfit that has invested in dozens of tech startups. He's been around since the days when Hotmail was the big new thing. He recently told The New Yorker that he believed tech venture capital may have reached the top of its cycle:

“I’ll draw you the cycle,” he said, taking my notepad and pen. He scrawled a large zigzag across the page. “This is a weird shark’s tooth that I kind of came up with. We’ll call it the Emotional Market of Venture Capital, or the Draper Wave.” He labeled all the valleys of the zigzag with the approximate years of low markets and recessions: 1957, 1968, 1974, 1983, and on. The lower teeth he labeled alternately “PE,” for private equity, and “VC,” for venture capital. Draper’s theory is that venture booms always follow private-equity crashes. “After a recession, people lose their jobs, and start thinking, Well, I can do better than they did. Why don’t I start a company? So then they start companies, and interesting things start happening, and then there’s a boom.” Eventually, though, venture capitalists get “sloppy”—they assume that anything they touch will turn to gold—and the venture market crashes. Then private-equity people streamline the system, and the cycle starts again. Right now, Draper suggested, we’re on a venture-market upswing. He circled the last zigzag on his diagram: the line rose and then abruptly ended.

"Abruptly ended"?

Let's hope he's wrong.
---

OK. That article when read fully (not just the snippets does give several examples that draw scary similarities to 1999 and the "Internet Bubble.")

Key Phrase
"Here's the evidence that we're in a new tech bubble, heading for a crash, just like the dot com bust of 1999."

But, believe it or jot, there are arguments, strong ones, that we are not in a bubble, but rather an economic boom.

Argument: We are NOT in a bubble

1. Home prices bottomed out in 2012 and have been rising by double-digits, year over year.

2. Existing home sales — which account for more than 90% of the housing market — are up double digits from last year even after Sep numbers:

"Home sales cooled in September because of higher interest rates, and the recent government shutdown may put a damper on activity for this month, too.

Existing home sales dropped 1.9% in September to a seasonally adjusted annual rate of 5.29 million from 5.39 million in August but were still up 10.7% from last year, the National Association of Realtors said Monday.

The decline was expected, given higher rates and rising home prices that pushed affordability to five-year lows, says Lawrence Yun, NAR chief economist."

Source: USA Today September existing home sales fall 1.9%

Ophir's Note: New Home Sales are starting to paint a different picture.

3. Unemployment is dropping.


United States Dept. of Labor

Here is the data in numbers, rather than a chart (same source):


United States Dept. of Labor

While there are good arguments made about (1) the "real unemployment rate" (adjusted for discouraged workers that leave the work force) is much higher and (2) the "quality" of jobs being created are poor and do not provide livable wages, the bottom line is, massive amounts have jobs have been created (of whatever kind).

Bigger point: There is room for this economy to grow since the long-term trend is closer to 5.5% unemployment.  That would mean we are not in a bubble (a peak), but actually in the midst of a continuing recovery.

OK.  That's it.

Now you decide.  Are we in a bubble or not?

My opinion... bubble -- no, overheated stock prices, yes, but they aren't ready to pop.  Not yet.  But what the hell do I know...seriously, what do I know?...

This is trade analysis, not a recommendation.


Legal Stuff:
Options involve risk. Prior to buying or selling an option, an investor must receive a copy of Characteristics and Risks of Standardized Options. Investors need a broker to trade options, and must meet suitability requirements.

The information contained on this site is provided for general informational purposes, as a convenience to the readers. The materials are not a substitute for obtaining professional advice from a qualified person, firm or corporation. Consult the appropriate professional advisor for more complete and current information. I am not engaged in rendering any legal or professional services by placing these general informational materials on this website.

I specifically disclaims any liability, whether based in contract, tort, strict liability or otherwise, for any direct, indirect, incidental, consequential, or special damages arising out of or in any way connected with access to or use of the site, even if I have been advised of the possibility of such damages, including liability in connection with mistakes or omissions in, or delays in transmission of, information to or from the user, interruptions in telecommunications connections to the site or viruses.

I make no representations or warranties about the accuracy or completeness of the information contained on this website. Any links provided to other server sites are offered as a matter of convenience and in no way are meant to imply that I endorse, sponsor, promote or am affiliated with the owners of or participants in those sites, or endorse any information contained on those sites, unless expressly stated.

NCR - Calendar Volatility Difference Opens; Skew Points to Upside Move in One Week


NCR is trading $34.60, up 2.5% with IV30™ up 5.4%. The Symbol Summary is included below.


Provided by Livevol

The stock just came up on a real-time custom scan. This one hunts for calendar spreads between the front two months.  But there is even more to this story, a curious skew shape divergence which exponentiates the calendar diff to the upside.

Custom Scan Details
Stock Price GTE $5
Sigma1 - Sigma2 GTE 8
Average Option Volume GTE 1,000
Industry isNot Bio-tech
Days After Earnings GTE 5 LTE 70
Sigma1, Sigma2 GTE 1

The goal with this scan is to identify back months that are cheaper than the front by at least 8 vol points. I'm also looking for a reasonable amount of liquidity in the options (thus the minimum average option volume), want to avoid bio-techs (and their crazy vol) and make sure I'm not selling elevated front month vol simply because earnings are approaching.

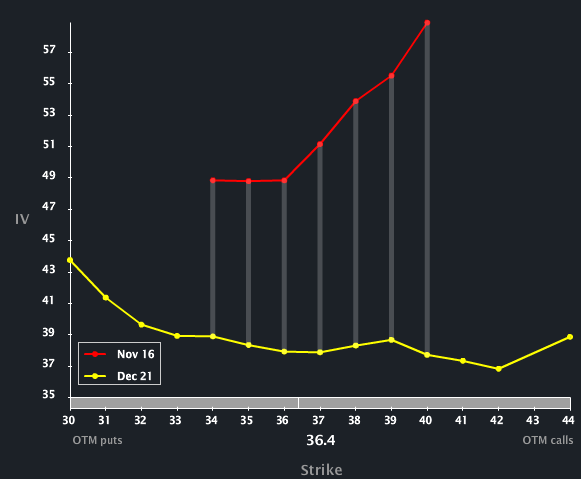
Let's start with the Skew Tab, below.

Provided by Livevol

We can see two phenomena here:
1. The red curve (Nov option volatility) is above the yellow curve (Dec option volatility) for all strike prices.

2. The red curve (Nov options) show a distinct bend to the upside, which means the out-of-the-money calls (OTM) are priced higher than the at-the-money (ATM) options and the OTM puts.  In English, the option market reflects a substantially higher likelihood of an upside move in NCR stock price in the near-term (the next eight calendar days) than it does in the medium-term (December expiration).

The result is a large widening of the volatility difference (the space in between the two curves) to the upside.  For the record, the current shape of the Nov (red curve) skew is "not normal."  To read about option skew, what it is and why it exists, you can read the post below by clicking on the title:

Understanding Option Skew -- What it is and Why it Exists

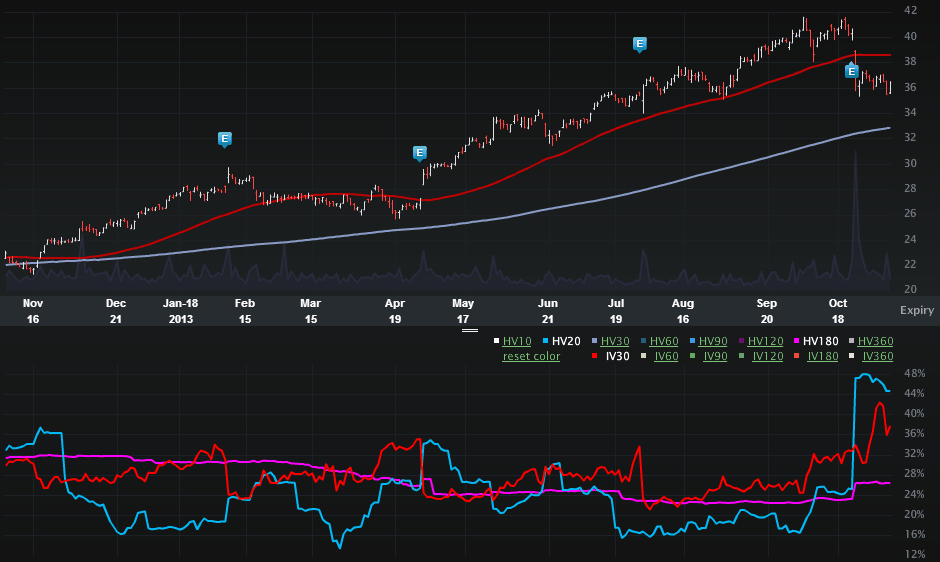
Now we can turn to the two-year Charts Tab (below). The top portion is the stock price, the bottom is the vol (IV30™ - red vs HV20™ - blue vs HV180™ - pink).

Provided by Livevol

We can see that NCR has climbed from $18.29 to $34.60 in two years, so a ~90% rise.  But, let us also note that the last earnings release showed a significant stock drop (the blue "E" icons represent earnings dates).  The stock fell from $40.53 to $36.25 in a single day.  So, we have a stock with a longer-term track record of remarkable equity performance, a short -term track record of disappointing earnings, more risk in the immediate-tem (Nov options) than the intermediate-term (Dec options), and finally, a higher probability of an upside move in Nov than Dec.

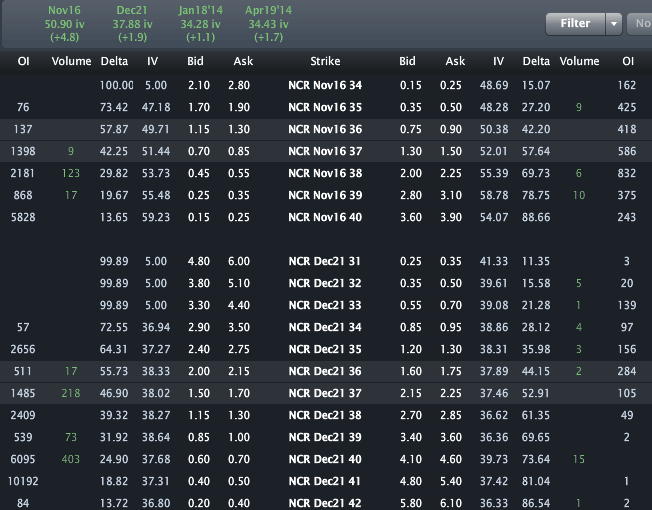
Finally, let's look to the Options Tab (below).

Provided by Livevol

Across the top we can see the monthly vols are priced to 50.90% and 37.88% for Nov and Dec respectively.  But, that ~13 vol point difference opens up to 22 vol points when you examine the OTM calls (like the Nov/Dec 40 call spread volatility difference).

Let's see if the next eight days do in fact prove to be volatile and to the upside for NCR, or if this is nothing more than noise.

This is trade analysis, not a recommendation.


Legal Stuff:
Options involve risk. Prior to buying or selling an option, an investor must receive a copy of Characteristics and Risks of Standardized Options. Investors need a broker to trade options, and must meet suitability requirements.

The information contained on this site is provided for general informational purposes, as a convenience to the readers. The materials are not a substitute for obtaining professional advice from a qualified person, firm or corporation. Consult the appropriate professional advisor for more complete and current information. I am not engaged in rendering any legal or professional services by placing these general informational materials on this website.

I specifically disclaims any liability, whether based in contract, tort, strict liability or otherwise, for any direct, indirect, incidental, consequential, or special damages arising out of or in any way connected with access to or use of the site, even if I have been advised of the possibility of such damages, including liability in connection with mistakes or omissions in, or delays in transmission of, information to or from the user, interruptions in telecommunications connections to the site or viruses.

I make no representations or warranties about the accuracy or completeness of the information contained on this website. Any links provided to other server sites are offered as a matter of convenience and in no way are meant to imply that I endorse, sponsor, promote or am affiliated with the owners of or participants in those sites, or endorse any information contained on those sites, unless expressly stated.

Thursday, November 7, 2013

So friend I offer you this one piece of advice - I say it once and you will not hear it twice.

There’s something that’s not quite right –
There’s one thing that remains my endless fight.

Touch me, feel me, push me around –
But don’t just stand there while I lie on the ground.

I taste your blood stained grin dripping with ache –
You circle me defenseless barely awake.

Take me with intensity and rage –
Do with me what you want just free me from my cage.

How can you fear me I lie alone –
My mind tattered and body stuck in stone.

Rise above me once and for all –
You have your chance to cause my fall.

Now your apprehension and suspense makes me question –
Can you not read my lifeless expression?

But you waited, and now I’ve returned.

Not your pacing and not your stare –
but my awakening and my glare.

Not your imposition and not your will –
but my encumbrance and my thrill.

You left a weakened soldier too long to recover –
You now find something even I could not discover.

Now I am awakened and am ready to war –
My birr returns and my passion once more.

It was not your way that woke me this time –
It was this silly little day and this silly little rhyme.

Buried and lost, left for dead –
Only a moment’s gasp hanging by a thread.

Now you see the improbable return –
Of a warrior’s heart and soul’s burn.

So friend I offer you this one piece of advice –
I say it once and you will not hear it twice.

Step back and caution my howling bay –
I am back from the dead, I am back today.