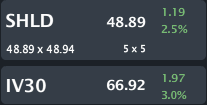
SHLD is trading $48.89, up 2.5% with IV30™ up 3.0%. The LIVEVOL® Pro Summary is below.
Provided by Livevol
Sears Holdings Corporation (Holdings) is a retailer with 2,172 full-line and 1,338 specialty retail stores in the United States operating through Kmart Holding Corporation (Kmart) and Sears, Roebuck and Co. (Sears) and 500 full-line and specialty retail stores in Canada operating through Sears Canada Inc. (Sears Canada), a 95%-owned subsidiary.
The stock just came up on a real-time custom scan. This one hunts for calendar spreads between the front two months.
Custom Scan Details
Stock Price GTE $5
Sigma1 - Sigma2 GTE 8
Average Option Volume GTE 1,000
Industry isNot Bio-tech
Days After Earnings GTE 5 LTE 70
Sigma1, Sigma2 GTE 1
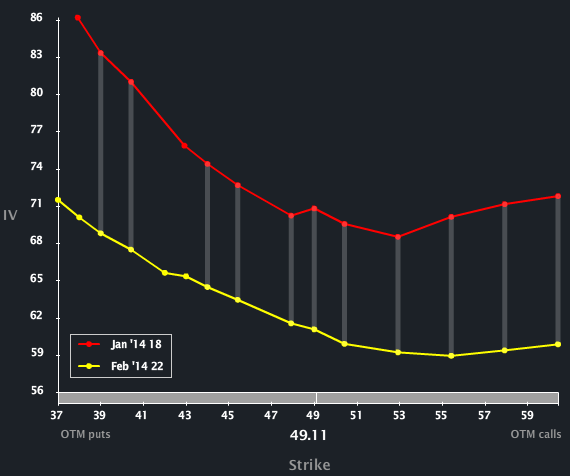
Looking to the Skew Tab (below), we can see the elevated vol in the front month (red line) relative to the second month (yellow line).
Provided by Livevol
While we can see the vol difference (and thus the trigger for the scan), I also note a parabolic skew shape. The option market reflects elevated upside and downside risk relative to the at-the-money (ATM) options. This skew shape is in fact normal for SHLD and has held for about a year. However, in general, this skew shape is not normal.
To read more about skew, what is and why it exists you can click the title below:
Understanding Option Skew -- What it is and Why it Exists.
This parabolic shape results in a volatility difference that grows as we move away from the ATM options. We'll see this explicitly in a sec.
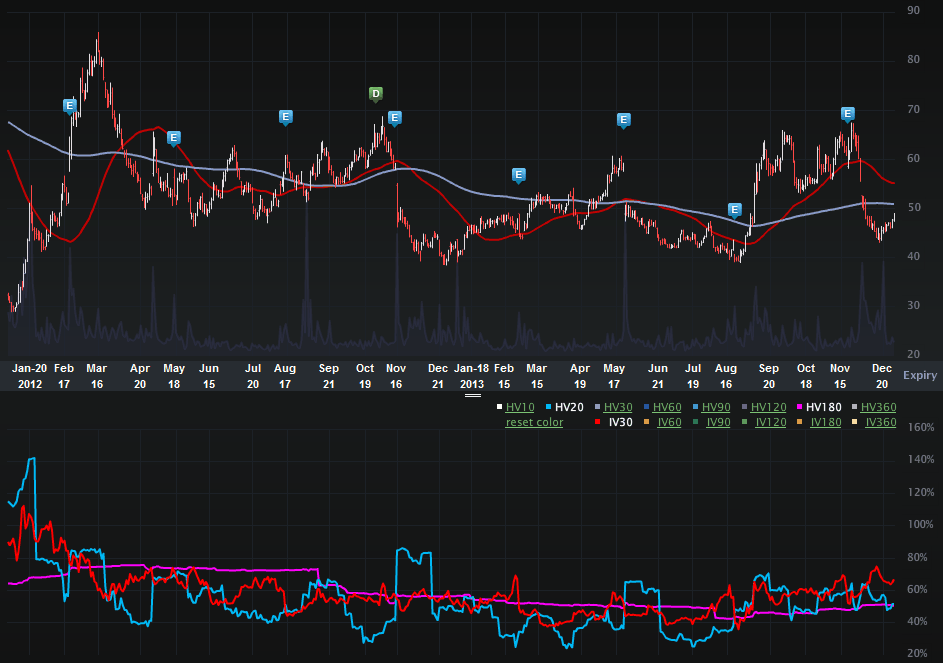
Now we can turn to the two-year Charts Tab (below). The top portion is the stock price, the bottom is the vol (IV30™ - red vs HV20™ - blue vs HV180™ - pink).
Provided by Livevol
For all of the fuss surrounding SHLD, over the last two-years the stock has risen from $31.43 to now $48.89 for a 55.6% rise. In that same period the S&P 500 is up ~44.5%. So, in English, SHLD has outperformed the index over a two-year period. The one-year comparison sees SHLD up ~18.10% while the index is up ~29.5%.
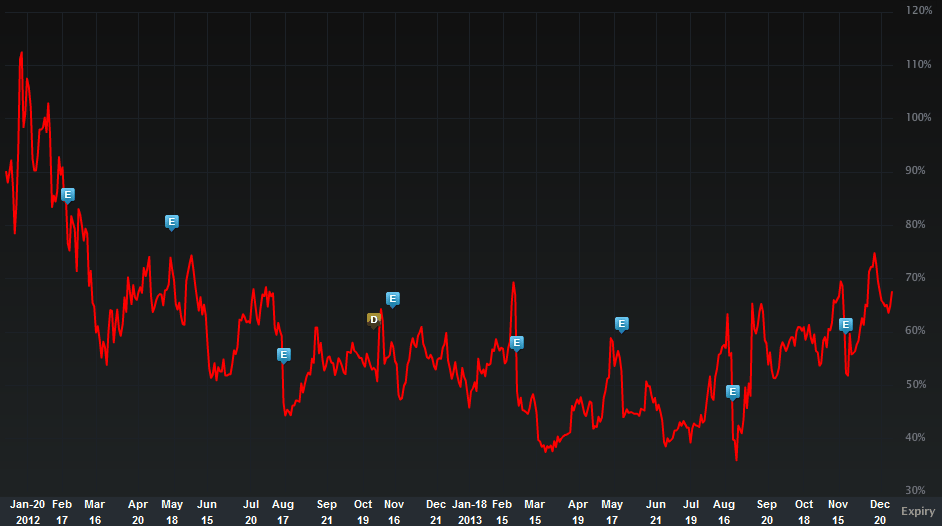
But this is a vol story, so looks let's turn to the two-year IV30™ chart in isolation, below.
Provided by Livevol
A few things to note:
1. The IV30™ traded well above 110% about two-years ago.
2. On a one-year measure, the IV30™ is in the 81st percentile (so pretty elevated).
3. The IV30™ breached its annual high on 12-16-2013 (74.79%) and has dipped a bit since then.
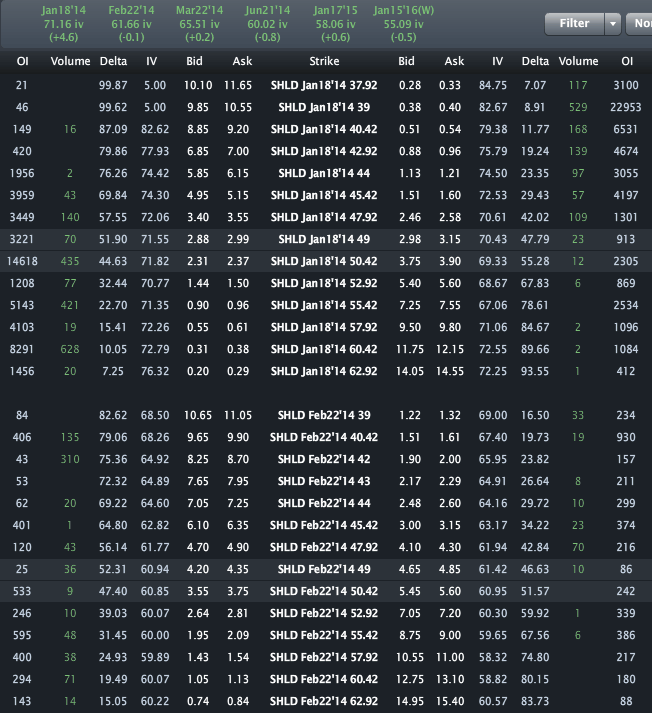
Finally, let's look to the Options Tab (below).
Provided by Livevol
Here's where we can see the explicit result of the parabolic skew:
While the ATM ($49 strike) vol difference is ~10 vol points, the Jan/Feb 39 put spread vol difference is ~13 vol points and the Jan/Feb 62.92 call spread vol diff is ~16 vol points.
This is trade analysis, not a recommendation.
Follow @OphirGottlieb
Tweet
Legal Stuff:
Options involve risk. Prior to buying or selling an option, an investor must receive a copy of Characteristics and Risks of Standardized Options. Investors need a broker to trade options, and must meet suitability requirements.
The information contained on this site is provided for general informational purposes, as a convenience to the readers. The materials are not a substitute for obtaining professional advice from a qualified person, firm or corporation. Consult the appropriate professional advisor for more complete and current information. I am not engaged in rendering any legal or professional services by placing these general informational materials on this website.
I specifically disclaim any liability, whether based in contract, tort, strict liability or otherwise, for any direct, indirect, incidental, consequential, or special damages arising out of or in any way connected with access to or use of the site, even if I have been advised of the possibility of such damages, including liability in connection with mistakes or omissions in, or delays in transmission of, information to or from the user, interruptions in telecommunications connections to the site or viruses.
I make no representations or warranties about the accuracy or completeness of the information contained on this website. Any links provided to other server sites are offered as a matter of convenience and in no way are meant to imply that I endorse, sponsor, promote or am affiliated with the owners of or participants in those sites, or endorse any information contained on those sites, unless expressly stated.


Is there some sort of event in January causing higher IV of the Jan options?
ReplyDeleteI'm not sure. Earnings look to be outside of Feb and I don't have any great visibility into what event could be propping up vol in Jan.
DeleteIt looks like even the Dec 13th options prior to their last earnings had lower IV than the Jan 14s are at now.
ReplyDelete