Tuesday, December 31, 2013

12-31-13: End of Day - New Highs/Lows, Implied Volatility Movers, Option Volume Movers, Elevated & Depressed IV/HV


New 52 Wk Highs in S&P 500


New 52 Wk Lows in S&P 500
None

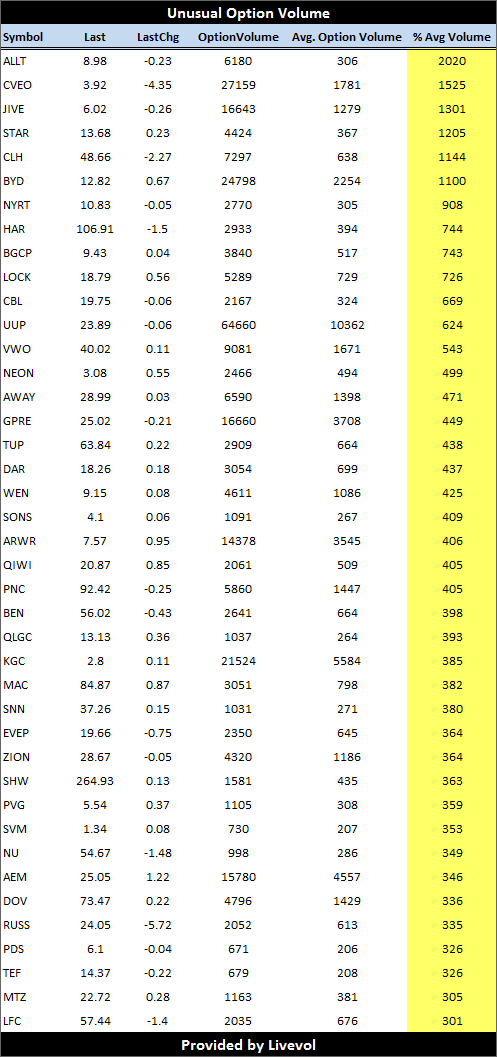
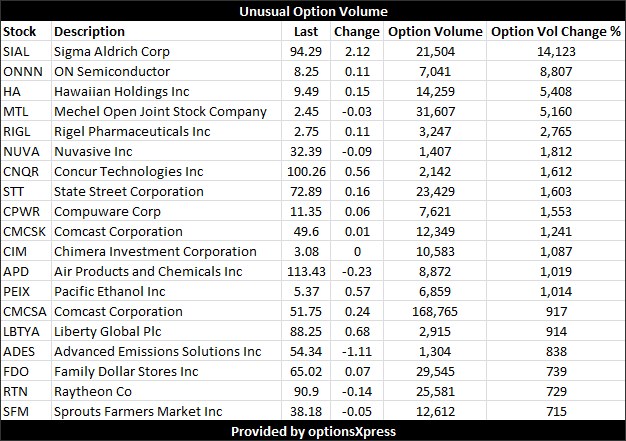
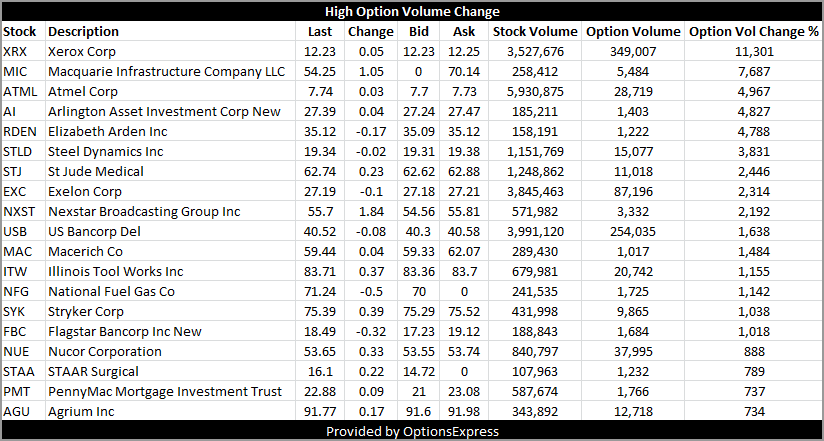
Unusual Option Volume


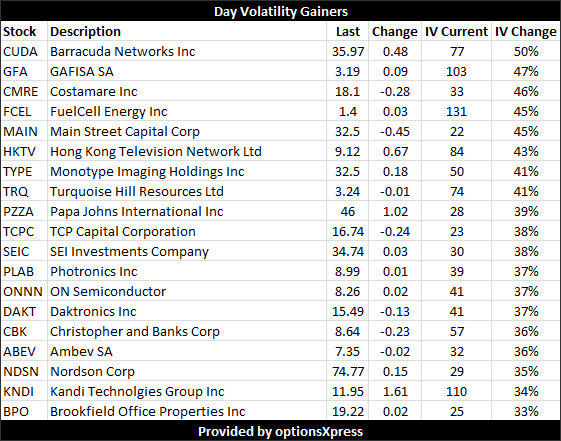
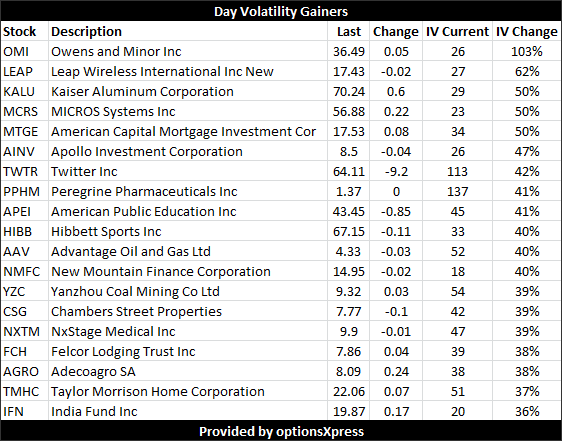
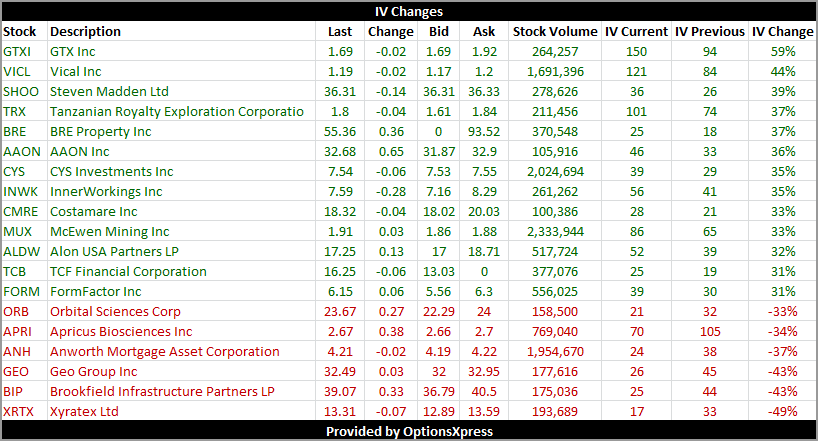
Unusual Volatility Moves


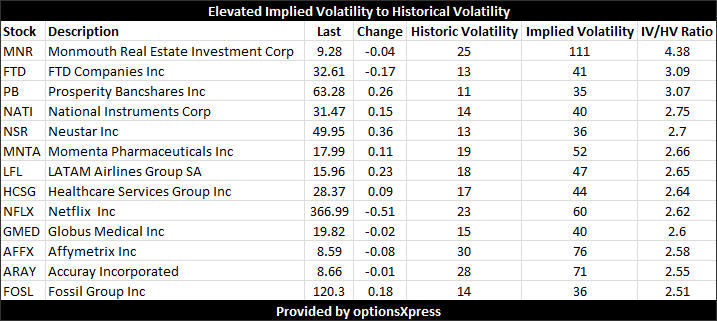
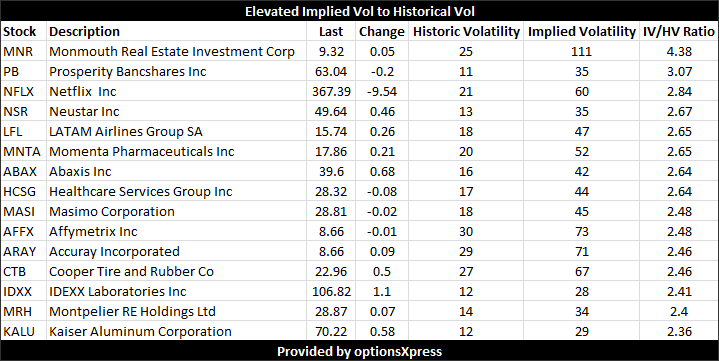
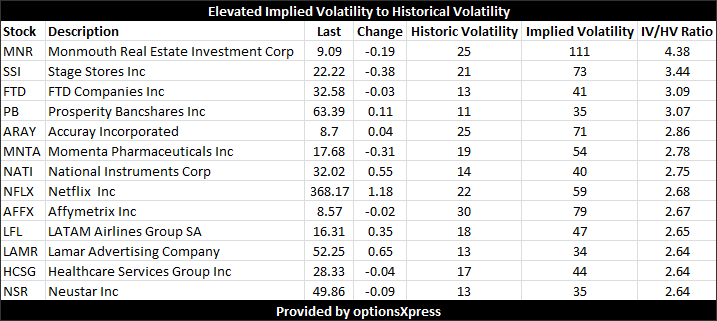
Elevated Implied Volatility (IV) to Historical Volatility (HV)


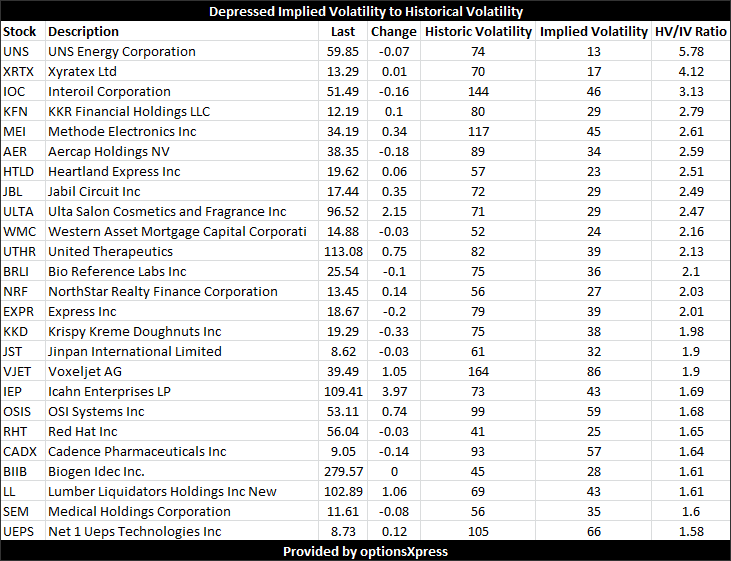
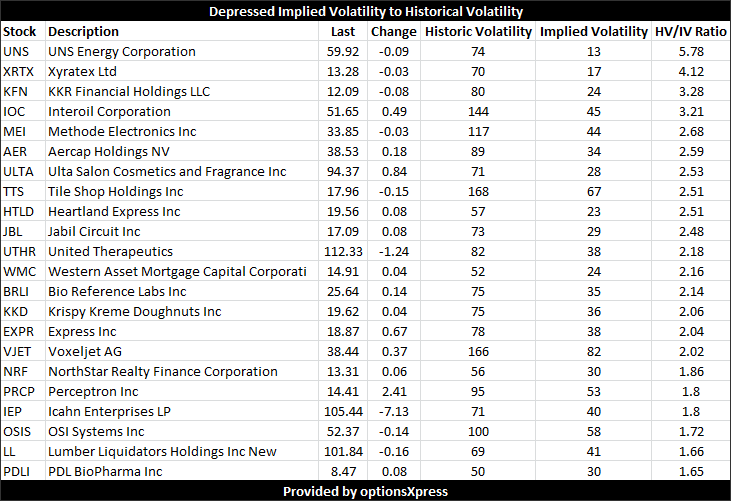
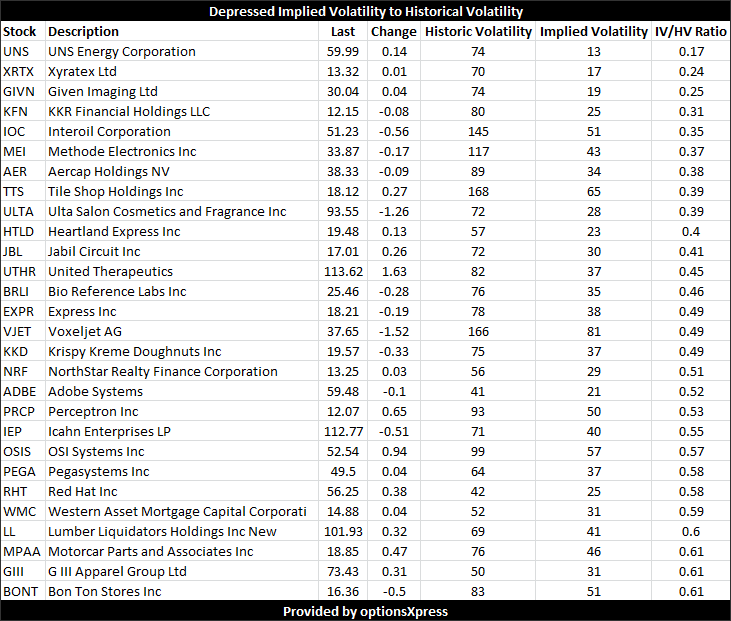
Depressed Implied Volatility (IV) to Historical Volatility (HV)


This is trade analysis, not a recommendation.


Legal Stuff:
Options involve risk. Prior to buying or selling an option, an investor must receive a copy of Characteristics and Risks of Standardized Options. Investors need a broker to trade options, and must meet suitability requirements.

The information contained on this site is provided for general informational purposes, as a convenience to the readers. The materials are not a substitute for obtaining professional advice from a qualified person, firm or corporation. Consult the appropriate professional advisor for more complete and current information. I am not engaged in rendering any legal or professional services by placing these general informational materials on this website.

I specifically disclaim any liability, whether based in contract, tort, strict liability or otherwise, for any direct, indirect, incidental, consequential, or special damages arising out of or in any way connected with access to or use of the site, even if I have been advised of the possibility of such damages, including liability in connection with mistakes or omissions in, or delays in transmission of, information to or from the user, interruptions in telecommunications connections to the site or viruses.

I make no representations or warranties about the accuracy or completeness of the information contained on this website. Any links provided to other server sites are offered as a matter of convenience and in no way are meant to imply that I endorse, sponsor, promote or am affiliated with the owners of or participants in those sites, or endorse any information contained on those sites, unless expressly stated.

Sears (SHLD) - Calendar Volatility Difference Opens to Elevated Jan; Parabolic Skew Persists


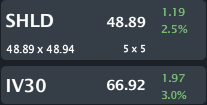
SHLD is trading $48.89, up 2.5% with IV30™ up 3.0%. The LIVEVOL® Pro Summary is below.


Provided by Livevol

Sears Holdings Corporation (Holdings) is a retailer with 2,172 full-line and 1,338 specialty retail stores in the United States operating through Kmart Holding Corporation (Kmart) and Sears, Roebuck and Co. (Sears) and 500 full-line and specialty retail stores in Canada operating through Sears Canada Inc. (Sears Canada), a 95%-owned subsidiary.

The stock just came up on a real-time custom scan. This one hunts for calendar spreads between the front two months.

Custom Scan Details
Stock Price GTE $5
Sigma1 - Sigma2 GTE 8
Average Option Volume GTE 1,000
Industry isNot Bio-tech
Days After Earnings GTE 5 LTE 70
Sigma1, Sigma2 GTE 1

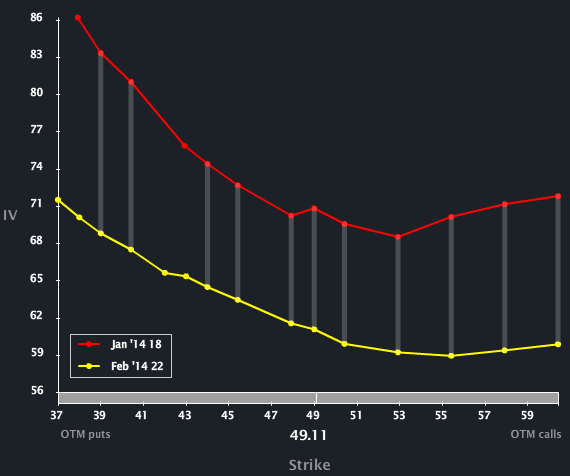
Looking to the Skew Tab (below), we can see the elevated vol in the front month (red line) relative to the second month (yellow line).

Provided by Livevol

While we can see the vol difference (and thus the trigger for the scan), I also note a parabolic skew shape.  The option market reflects elevated upside and downside risk relative to the at-the-money (ATM) options.  This skew shape is in fact normal for SHLD and has held for about a year.  However, in general, this skew shape is not normal.

To read more about skew, what is and why it exists you can click the title below:
Understanding Option Skew -- What it is and Why it Exists.

This parabolic shape results in a volatility difference that grows as we move away from the ATM options.  We'll see this explicitly in a sec.

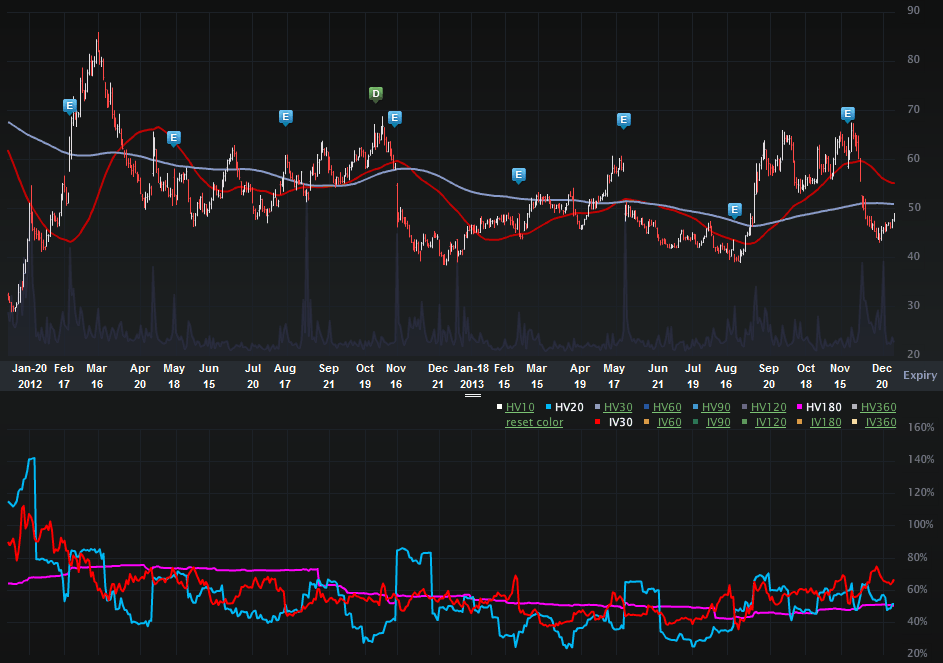
Now we can turn to the two-year Charts Tab (below). The top portion is the stock price, the bottom is the vol (IV30™ - red vs HV20™ - blue vs HV180™ - pink).

Provided by Livevol

For all of the fuss surrounding SHLD, over the last two-years the stock has risen from $31.43 to now $48.89 for a 55.6% rise.  In that same period the S&P 500 is up ~44.5%.  So, in English, SHLD has outperformed the index over a two-year period.  The one-year comparison sees SHLD up ~18.10% while the index is up ~29.5%.

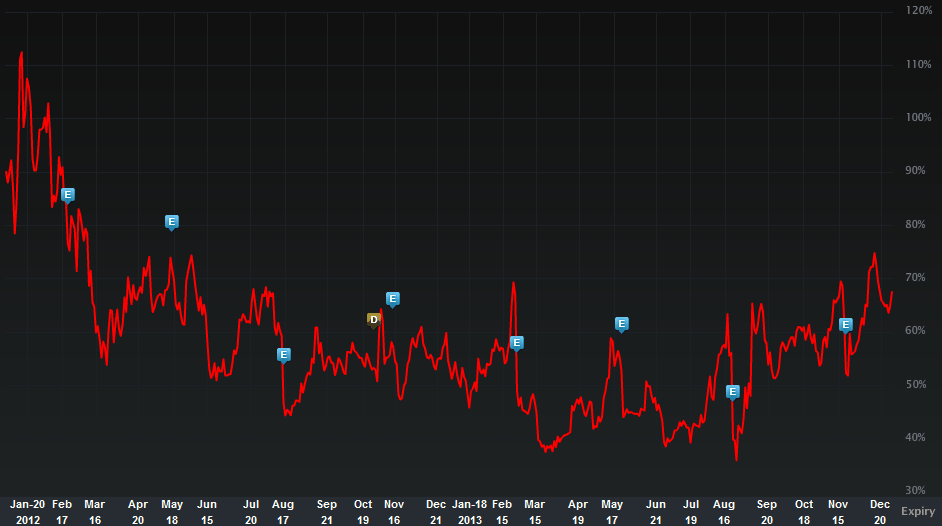
But this is a vol story, so looks let's turn to the two-year IV30™ chart in isolation, below.

Provided by Livevol

A few things to note:

1. The IV30™ traded well above 110% about two-years ago.
2. On a one-year measure, the IV30™ is in the 81st percentile (so pretty elevated).
3. The IV30™ breached its annual high on 12-16-2013 (74.79%) and has dipped a bit since then.

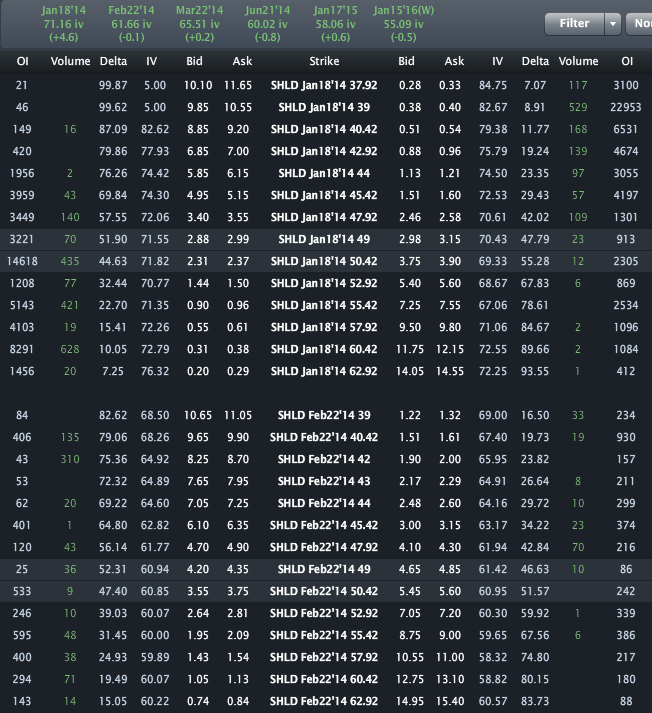
Finally, let's look to the Options Tab (below).

Provided by Livevol

Here's where we can see the explicit result of the parabolic skew:

While the ATM ($49 strike) vol difference is ~10 vol points, the Jan/Feb 39 put spread vol difference is ~13 vol points and the Jan/Feb 62.92 call spread vol diff is ~16 vol points.

This is trade analysis, not a recommendation.


Legal Stuff:
Options involve risk. Prior to buying or selling an option, an investor must receive a copy of Characteristics and Risks of Standardized Options. Investors need a broker to trade options, and must meet suitability requirements.

The information contained on this site is provided for general informational purposes, as a convenience to the readers. The materials are not a substitute for obtaining professional advice from a qualified person, firm or corporation. Consult the appropriate professional advisor for more complete and current information. I am not engaged in rendering any legal or professional services by placing these general informational materials on this website.

I specifically disclaim any liability, whether based in contract, tort, strict liability or otherwise, for any direct, indirect, incidental, consequential, or special damages arising out of or in any way connected with access to or use of the site, even if I have been advised of the possibility of such damages, including liability in connection with mistakes or omissions in, or delays in transmission of, information to or from the user, interruptions in telecommunications connections to the site or viruses.

I make no representations or warranties about the accuracy or completeness of the information contained on this website. Any links provided to other server sites are offered as a matter of convenience and in no way are meant to imply that I endorse, sponsor, promote or am affiliated with the owners of or participants in those sites, or endorse any information contained on those sites, unless expressly stated.

2013 - Top Stories... And There Were a Lot...


With 2014 around the corner, let's look back at the top stories of 2013.  You can click on the title to read the posts.

1. Just the Facts Ma'am: Is the United States in a Bubble? Does the United States Look Identical to Japan Right Now?

2. Twitter (TWTR) - UPDATE: How the Option Market Totally Blew It, And We Knew it Two-Weeks Ago.

3. VIX - Part 5: Doomsday/Bubble Scenarios: Its the Volatility of the VIX that's Our Signal; Not the VIX Itself

4. Apple (AAPL) - Part 7 (The End): This Just Isn't the Company it Used to Be... And it Never Will Be Again.

5. Op-Ed: Fukushima Nuclear Disaster - The Lies They've Told; 15 Things You Should Know; And How This Could Be a Global Killer

6. Tesla (TSLA) - Now a $20B Firm Off of Earnings Blow Out; How Wall St. Absolutely Blew It; But I didn't... And I'm Just a Guy...

7. Netflix (NFLX) - Is this the Most Powerful Firm in Entertainment? Some Things I Bet You Didn't Know... But Want to.

8. No Noise, Here are the Facts, and Why: The Market Will Go Up. The Market Will Go Down

9. Understanding Option Skew -- What it is and Why it Exists

10. McGraw Hill (MHP) - Vol Explodes on News of 10-figure Law Suit; S&P Needs to Burn on This One (and so does Moody's)


This is trade analysis, not a recommendation.


Legal Stuff:
Options involve risk. Prior to buying or selling an option, an investor must receive a copy of Characteristics and Risks of Standardized Options. Investors need a broker to trade options, and must meet suitability requirements.

The information contained on this site is provided for general informational purposes, as a convenience to the readers. The materials are not a substitute for obtaining professional advice from a qualified person, firm or corporation. Consult the appropriate professional advisor for more complete and current information. I am not engaged in rendering any legal or professional services by placing these general informational materials on this website.

I specifically disclaim any liability, whether based in contract, tort, strict liability or otherwise, for any direct, indirect, incidental, consequential, or special damages arising out of or in any way connected with access to or use of the site, even if I have been advised of the possibility of such damages, including liability in connection with mistakes or omissions in, or delays in transmission of, information to or from the user, interruptions in telecommunications connections to the site or viruses.

I make no representations or warranties about the accuracy or completeness of the information contained on this website. Any links provided to other server sites are offered as a matter of convenience and in no way are meant to imply that I endorse, sponsor, promote or am affiliated with the owners of or participants in those sites, or endorse any information contained on those sites, unless expressly stated.


Monday, December 30, 2013

12-30-2013: Option Market End of Day - Implied Volatility Movers, Option Volume Movers, Elevated and Depressed IV/HV


Unusual Option Volume


Unusual Volatility Moves


Elevated Implied Volatility (IV) to Historical Volatility (HV)


Depressed Implied Volatility (IV) to Historical Volatility (HV)


This is trade analysis, not a recommendation.


Legal Stuff:
Options involve risk. Prior to buying or selling an option, an investor must receive a copy of Characteristics and Risks of Standardized Options. Investors need a broker to trade options, and must meet suitability requirements.

The information contained on this site is provided for general informational purposes, as a convenience to the readers. The materials are not a substitute for obtaining professional advice from a qualified person, firm or corporation. Consult the appropriate professional advisor for more complete and current information. I am not engaged in rendering any legal or professional services by placing these general informational materials on this website.

I specifically disclaim any liability, whether based in contract, tort, strict liability or otherwise, for any direct, indirect, incidental, consequential, or special damages arising out of or in any way connected with access to or use of the site, even if I have been advised of the possibility of such damages, including liability in connection with mistakes or omissions in, or delays in transmission of, information to or from the user, interruptions in telecommunications connections to the site or viruses.

I make no representations or warranties about the accuracy or completeness of the information contained on this website. Any links provided to other server sites are offered as a matter of convenience and in no way are meant to imply that I endorse, sponsor, promote or am affiliated with the owners of or participants in those sites, or endorse any information contained on those sites, unless expressly stated.

VIX - Part 5: Doomsday/Bubble Scenarios: Its the Volatility of the VIX that's Our Signal; Not the VIX Itself


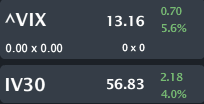
VIX spot is quoting $13.16, up 5.6% with IV30™ up 4.0%. The Symbol Summary is included below.


Provided by Livevol


This is a follow up to a four part series on VIX and the volatility of VIX relative to doomsday scenarios that were conjured up when the gov't shutdown was the top headline.

I also recently posted an article surrounding the idea of a market bubble which you can read by clicking on the title below:
Just the Facts Ma'am: Is the United States in a Bubble? Does the United States Look Identical to Japan Right Now?

The basic conclusion of this article is:

1. I see a market malaise in the options, and that is worth watching very closely.

2. Here's the thing, and there's just no way around it, while the option market has been pricing in low forward looking 30-day volatility in VIX, the option market has been dead wrong.

3. I posted a number of articles on specific names last week, namely TWTR, NFLX and GOOG. Now I'm looking more broadly at the SPX, and I see the same thing. Yes, implied volatility goes down (generally) as markets rise, as the holidays come, etc... But this doesn't feel right.

You can read the prior posts in this VIX series by clicking on the titles below:

11-1-2013: VIX - Doomsday is Over; But Did You Know This? I Didn't...

10-11-2013: Update #3: Doomsday Scenarios: It’s the Volatility of the VIX that is Our Signal; Not the VIX Itself

10-8-2013: Follow Up; It's the Implied Vol of the VIX that is Our Signal; Did a Bi-partisan Congressional Vote Bring us to the Brink of Another Great Depression?

10-3-2013: VIX - Doomsday Scenarios; It's Not the VIX that Matters; It's the IV of the VIX That is Our Signal


Let's go back in time for a summary, then forward to today and after.

-----
From 11-1-2013
The crux of those stories was simply this:

Those articles surrounded the idea of whether or not (or how) VIX could be used as signal to the potential doomsday scenarios that were being discussed if the US government defaulted on its national debt. The main conclusion I came to (which is my opinion) is that it’s not the VIX that is our signal, but rather than implied volatility of the VIX. I still feel the same way. Those articles and that time frame proved the hypothesis to be correct (for that time frame).

While the doomsday scenarios are gone, that story, the vol of the VIX still lives. And the story is moving rather quickly.  On the spot price side we can saw the VIX falling from on high two-years ago to now (11-1-2013), quite depressed levels relative to the last five years.

But, you know where I'm going.. straight to the IV30™ chart of the VIX (the two-year implied volatility chart of the VIX).

11-1-2013

Provided by Livevol

That two-year high was the teetering point for the market - the line in the sand as I called it. Even though the volatility of the VIX dropped the next day, the market was actually down as was the VIX itself.  But let's look at today (11-1-2013) -- the far right.  We can see that the IV30™ of the VIX is right on two-year lows, and if we go back further, it's several year lows.  There is a calm in the market that makes me feel... not so calm.  Not because I believe we're going to have any kind of spasm in the market until year end (I have no idea), but for the future beyond 2013.  What has me worried... Check this out.


Let's turn to the Options Tab, below.

11-1-2013

Provided by Livevol

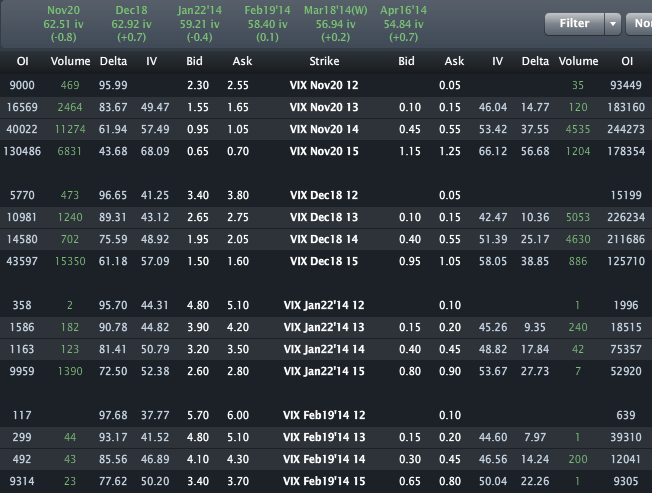
Look at those green numbers across the top.  Those numbers represent the implied volatility by expiry.  And what about them?... they're getting lower monotonically (other than Dec) through April 2014.  Here they are:

Nov: 62.51%
Dec: 62.92%
Jan'14: 59.21%
Feb'14: 58.40%
Apr'14: 54.84%

How confident are you that the market will not only stay at this level of risk, but will reduce substantially all the way though April 2014?  The option market reflects a great deal of comfort; a new equilibrium, a relaxed and quiet equilibrium. Is there an event in the near future (before April 2014) that may be evidence to the contrary? If you said no... think harder...

--------------

Ok, that was a summary of the prior posts.  Let's turn to today.

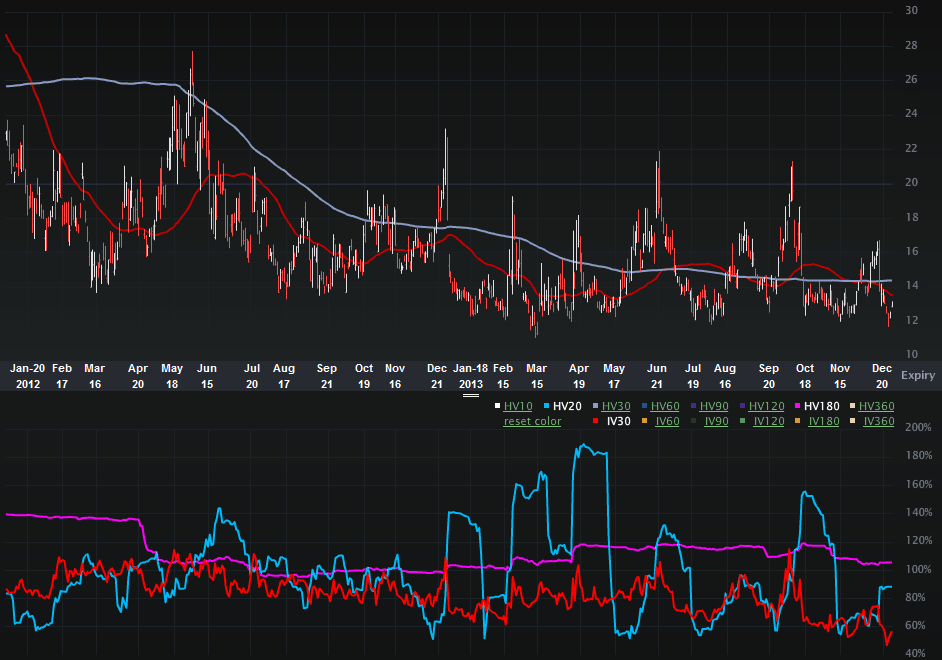
The Charts Tab (two-years) is below. The top portion is the stock price, the bottom is the vol (IV30™ - red vs HV20™ - blue vs HV180™ - pink).

Provided by Livevol

On the spot side, we can see that VIX has maintained its depressed levels relative to the last two-years.  We can also see a little move up in the last few trading sessions on whole.

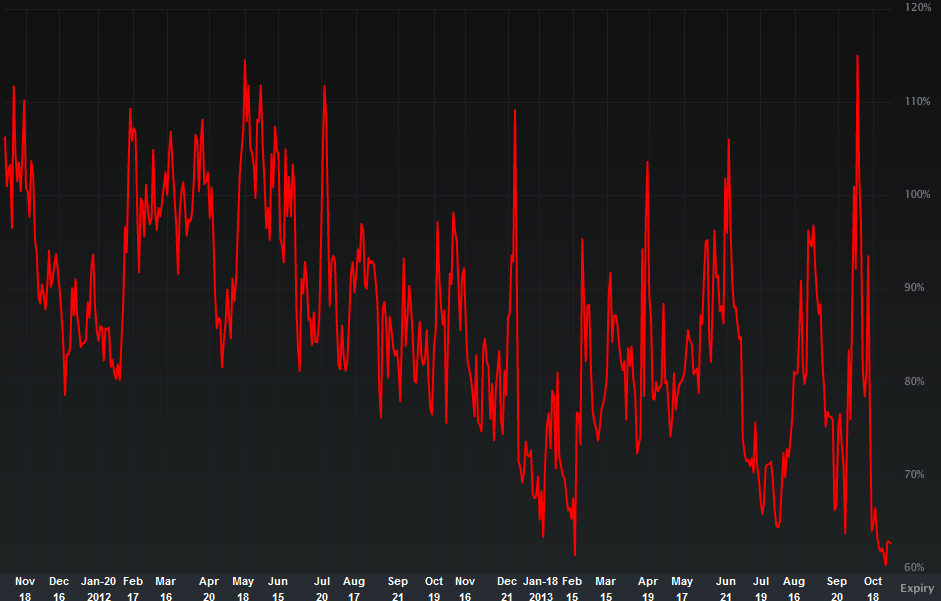
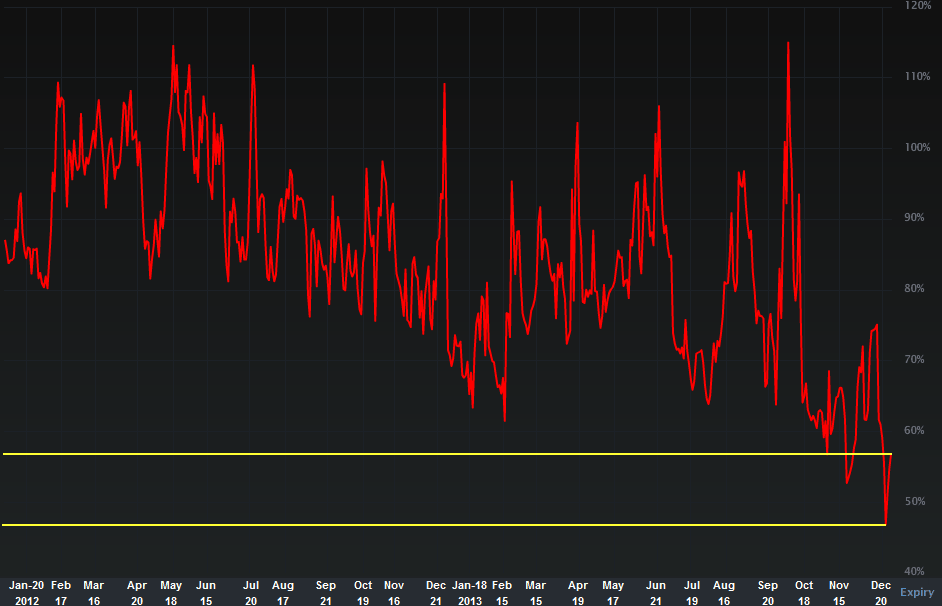
But where do I really want to look?... Of course, the volatility chart. Let's turn to the IV30™ chart in isolation, below.

Provided by Livevol

The post on 11-1-2013 so the volatility of the VIX at 62.67% (so well above the current level).  Just past week we can see that the volatility of the VIX hit multi-year low; that's the bottom horizontal line.

The second horizontal line simply marks the current level of the implied volatility in the VIX.  Both levels are quite low (obviously).

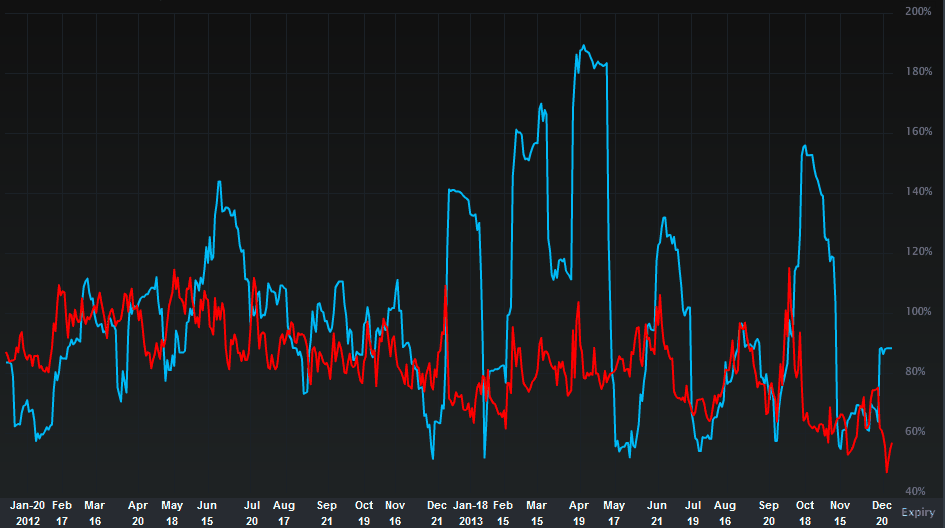
Here's the thing, and there's just no way around it, while the option market has been pricing in low forward looking 30-day volatility in VIX, the option market has been dead wrong.  How do we know this?...

Let's look at the identical chart above, but with the HV20™ added to the chart.

So the IV30™ (red curve) is what the option market was pricing looking forward (forecasting) while the HV20™ (blue curve) is what actually happened (the actual realized volatility).

Provided by Livevol

What do ya know...That blue line spikes well above that red line quite often and as of this writing we have:

IV30™: 56.83%
HV20™: 88.27%

So, in English, the option market reflects about 57% annualized risk over the next 30 calendar days in the VIX, while the last 20 trading days (which is about 30 calendar days) have shown ~88% annualized volatility.

So what? I think the option market reflects a malaise, a sort of sleepy view of forward looking risk.  I posted a number of articles on specific names last week, namely TWTR, NFLX and GOOG. I have included those posts below.  You can read them by clicking on the titles.

12-27-2013: Netflix (NFLX) - UPDATE: The Giant Killer is a Giant, But the Option Market is Still Asleep. What Happens When it Wakes Up?


12-26-2013: Google (GOOG) - Volatility Dipping; Has the Option Market Fallen into a Mistaken Malaise?


12-26-2013: Twitter (TWTR) - UPDATE: How the Option Market Totally Blew It, And We Knew it Two-Weeks Ago.


The TWTR one of course proved to be a total mis-pricing by the option market. The other two, we don't know yet.

Now I'm looking more broadly at the SPX, and I see the same thing. Yes, implied volatility goes down (generally) as markets rise, as the holidays come, etc... But this doesn't feel right.

Finally, the Options Tab is included below.

Provided by Livevol

Last time (11-1-2013) we saw:

Nov: 62.51%
Dec: 62.92%
Jan'14: 59.21%
Feb'14: 58.40%
Apr'14: 54.84%

Now we see:

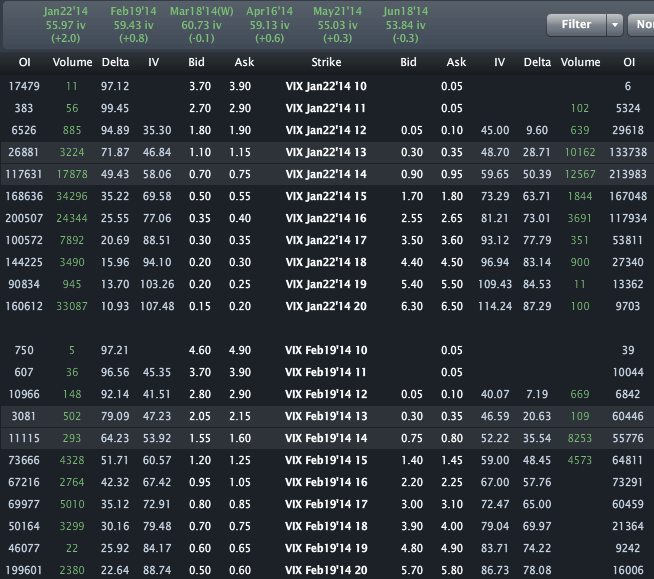
Jan'14: 55.97%
Feb'14: 59.43%
Apr'14: 59.13%

Note that Feb and Apr are showing higher implied volatility than they did on 11-1-2013.  This is actually a move in the right direction n my opinion.  The Jan vol however has gone down...

I guess we'll see, but I see a market malaise in the options, and that is worth watching very closely.

This is trade analysis, not a recommendation.


Legal Stuff:
Options involve risk. Prior to buying or selling an option, an investor must receive a copy of Characteristics and Risks of Standardized Options. Investors need a broker to trade options, and must meet suitability requirements.

The information contained on this site is provided for general informational purposes, as a convenience to the readers. The materials are not a substitute for obtaining professional advice from a qualified person, firm or corporation. Consult the appropriate professional advisor for more complete and current information. I am not engaged in rendering any legal or professional services by placing these general informational materials on this website.

I specifically disclaim any liability, whether based in contract, tort, strict liability or otherwise, for any direct, indirect, incidental, consequential, or special damages arising out of or in any way connected with access to or use of the site, even if I have been advised of the possibility of such damages, including liability in connection with mistakes or omissions in, or delays in transmission of, information to or from the user, interruptions in telecommunications connections to the site or viruses.

I make no representations or warranties about the accuracy or completeness of the information contained on this website. Any links provided to other server sites are offered as a matter of convenience and in no way are meant to imply that I endorse, sponsor, promote or am affiliated with the owners of or participants in those sites, or endorse any information contained on those sites, unless expressly stated.

Friday, December 27, 2013

12-27-2013: Option Market End of Day - Implied Volatility Movers, Option Volume Movers


Names to watch in tomorrow's action...

Unusual Option Volume

Provided by optionsXpress


Unusual Volatility Moves

Provided by optionsXpress


Elevated Implied Volatility (IV) to Historical Volatility (HV)

Provided by optionsXpress


Depressed Implied Volatility (IV) to Historical Volatility (HV)

Provided by OptionsXpress


This is trade analysis, not a recommendation.


Legal Stuff:
Options involve risk. Prior to buying or selling an option, an investor must receive a copy of Characteristics and Risks of Standardized Options. Investors need a broker to trade options, and must meet suitability requirements.

The information contained on this site is provided for general informational purposes, as a convenience to the readers. The materials are not a substitute for obtaining professional advice from a qualified person, firm or corporation. Consult the appropriate professional advisor for more complete and current information. I am not engaged in rendering any legal or professional services by placing these general informational materials on this website.

I specifically disclaim any liability, whether based in contract, tort, strict liability or otherwise, for any direct, indirect, incidental, consequential, or special damages arising out of or in any way connected with access to or use of the site, even if I have been advised of the possibility of such damages, including liability in connection with mistakes or omissions in, or delays in transmission of, information to or from the user, interruptions in telecommunications connections to the site or viruses.

I make no representations or warranties about the accuracy or completeness of the information contained on this website. Any links provided to other server sites are offered as a matter of convenience and in no way are meant to imply that I endorse, sponsor, promote or am affiliated with the owners of or participants in those sites, or endorse any information contained on those sites, unless expressly stated.

Netflix (NFLX) - UPDATE: The Giant Killer is a Giant, But the Option Market is Still Asleep. What Happens When it Wakes Up?


This is a quick update to the article published on 12-21-213:
Netflix (NFLX) - The Giant Killer is a Giant, But the Option Market is Still Asleep. What Happens When it Wakes Up?

I have actually included the entire post below, with one update, which is today's (12-27-2013) intraday Symbol Summary:
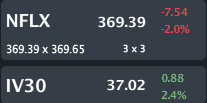
Provided by Livevol


The premise of the first post was simply that the implied volatility for NFLX felt pretty low reflecting, potentially, not enough risk in the share price in the near-term.  Today we already see that the price is $6.28 lower and the volatility is 3.26 vol points or ~10% higher.

------------------

From 12-21-2013


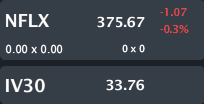
NFLX closed Friday trading at $375.67, down 0.3% with IV30™ down small... again. The Symbol Summary is included below.

Provided by Livevol

Netflix, Inc. is an Internet television network with more than 33 million members in over 40 countries. In the United States, the Company’s subscribers can receive standard definition digital versatile disc (DVDs), and their high definition successor, Blu-ray discs (collectively DVD), delivered quickly to their homes.

I have written extensively on NFLX -- it really is one of my favorite subjects and favorite companies (that doesn't mean I have a position).  This option market has continued to show incredibly low risk n the stock and we have yet again hit another multi-year low in the implied.

Before I get started on the "today," let's look at the prior posts with some snippets.   You can read any post by simply clicking on the title:

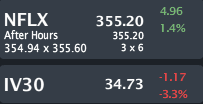
11-26-2013: Netflix (NFLX) - This Newly Minted Giant Has a Big Secret; But It's in the Option Market...

11-26-2013
Provided by Livevol


10-15-2013: Netflix (NFLX) - How a New Industry Giant Shows 'Cheap' (?) Volatility into Earnings; Did You Know This?

9-18-2013: Netflix (NFLX) - The New Giant -- Stock Near All-time High but Volatility Collapses to Multi-year Low

9-10-2013: Netflix (NFLX) - Is this the Most Powerful Firm in Entertainment? Some Things I Bet You Didn't Know... But Want to.

4-25-2013: Netflix (NFLX) - Vol Nears Multi-Year Lows as Stock Explodes; Hollywood Take Note -- Another Shot Across Major Distributor’s Bows

This is a volatility note.  The first time I note low volatility in NFLX it was trading $216 at 46% vol. Today it is $375 at 33.76% vol. Here is a quick review from the most recent posts, which is relevant to this note which surrounds substantially depressed volatility in the option market.

---
So why is this happening to NFLX? Well, a lot of reasons, but one of the biggest is pretty simple:

NFLX now decides which TV shows are hits. Yeah, that's right. For example, the AMC original show Breaking Bad, the highest rated TV show ever by meta critics, was at a point after season 4 where its record viewership for any one episode was ~1.5 million people. That's actually very low.

An agreement was struck to put all of the "Breaking Bad" old seasons on NFLX for free (everything is free on NFLX with the monthly subscription). The first episode of season 5 aired to 3 million viewers (so a 100% increase). Then, the first episode of season 5 part II aired to 6 million viewers (NB: My numbers may be off wrt which season the bump(s) happened, do some fact checking before quoting me). OK, OK, is this really b/c of NFLX? Well, here's a direct quote from the show's creator, Vince Gilligan:

---
"I am grateful as hell for binge-watching. I am grateful that AMC and Sony took a gamble on us in the first place to put us on the air. But I'm just as grateful for an entirely different company that I have no stake in whatsoever: Netflix. I don't think you'd be sitting here interviewing me if it weren't for Netflix. In its third season, Breaking Bad got this amazing nitrous-oxide boost of energy and general public awareness because of Netflix."
---

Why does this matter? How about this... Instead of NFLX paying for content, the content providers may pay NFLX to air their shows. That's incredible.

Add to the fact that NFLX now has critically acclaimed original content -- that's content available ONLY on NFLX ("House of Cards" and "Orange is the New Black" are two of them) and what we're slowly finding here is that NFLX may become the most powerful content distributor for TV (the profitable part of the entertainment business) on the planet.

Don't laugh or roll eyes, it's happening right now. FOX is tying the same game as AMC did with "Breaking Bad" with their sitcom "The New Girl." And you know what?... it's working again...

Now NFLX does have competitors, namely AMZN (I know they're not the first name to come up from entertainment industry folks, but the entertainment industry is wrong -- AMZN is the risk for NFLX). Another risk is the content creators using their own channels (no pun intended)... but that doesn't seem to work so far (and yeah I know what Hulu is and who created it).

Here's more news, from CNBC a day after I posted this article:
---
Groundbreaking news that Virgin Media is bringing Netflix directly to its set-top box in the U.K. in effect elevates Netflix to the status of a new cable network-a benefit for a cable company and beyond being an upstart threat to cable.


The stock's nearly 220 percent gains this year have been driven largely by the success of its original content deals, which have helped add new subscribers, giving Wall Street confidence that exclusive originals will continue to deliver.

(More from Julia Boorstin: Is Apple's iRadio a Pandora killer? )

Virgin's parent, Liberty Global (LBTYA), gained just under a percentage point on Tuesday's news.

Virgin Media's partnership with Netflix is the first time a cable operator is bringing the streaming service directly to the set-top box. Other cable operators-like Comcast (CMCSA)-allow users to access Netflix through Internet-connected set-top boxes-but this is the first time a cable channel has directly made a deal with Netflix to treat its content just like that provided by cable channels like HBO (owned by Time Warner (TWX)) and Showtime (owned by CBS (CBS)). (Disclosure: Comcast is the owner of NBCUniversal, the parent company of CNBC and CNBC.com.)

Virgin will integrate Netflix with its television content so it's easy to seamlessly browse and search across both TV and streaming content.

Source: CNBC via Yahoo! Finance Why Netflix is at a new all-time high, written by Julia Boorstin.
---

On 10-15-2013 I noted that the volatility into earnings for NFLX was quite low.  The stock did in fact go from ~$355 to~$322 in a single day (while in that same day hitting $389, then dropping $65 intra-day). 


So the stock is up huge,the importance of this firm in the industry is up huger and the valuation proves it.  We're talking about a $21 billion firm now.

But here's the the thing, and there's no way around it.  The higher NFLX stock goes and the more power it has in the industry, the greater the potential fall.  I am a huge fan of NFLX and their management team's ability to resurrect a firm that many thought was dead to an incredibly powerful "new" firm. But, at these valuations, there is risk.  Also, there is substantial risk of higher valuations.

While $22 billion is a big firm, why can't NFLX be worth $100 billion?  So, I say, there is risk to both sides in this stock, yet the option market tells me I am wrong... and here's why...

Today (12-21-2013)

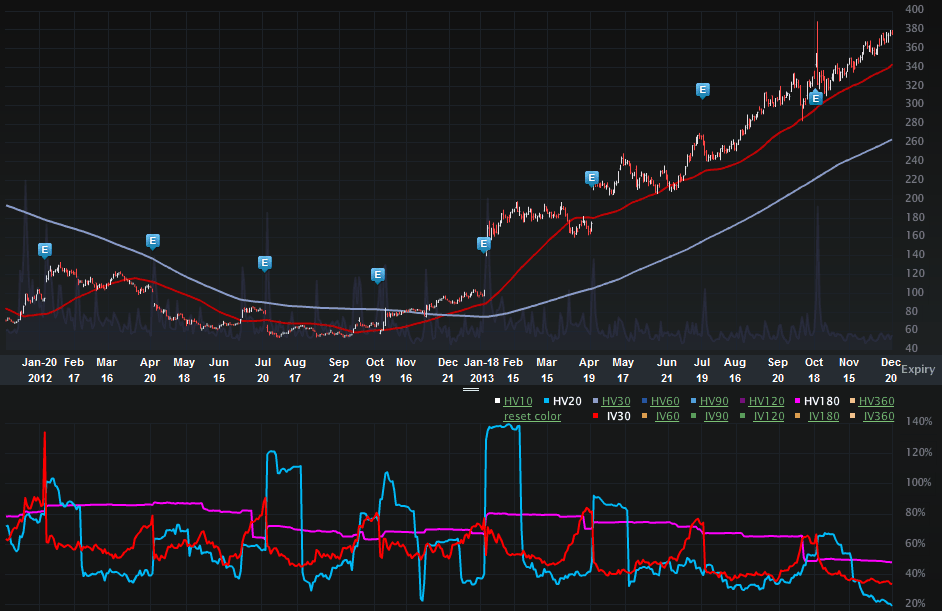
The two-year Charts Tab is included below.  The top portion is the stock price, the bottom is the vol (IV30™ - red vs HV20™ - blue vs HV180™ - pink).
Provided by Livevol

On the stock side we can see the remarkable run up from ~$55 to now $375, and all of this after the went from $10 to $300 and then back to $50.  As I have said several times, the management team at NFLX absolutely shocked the world twice.  First to become a giant, then to recover from the ashes to become an even bigger giant.

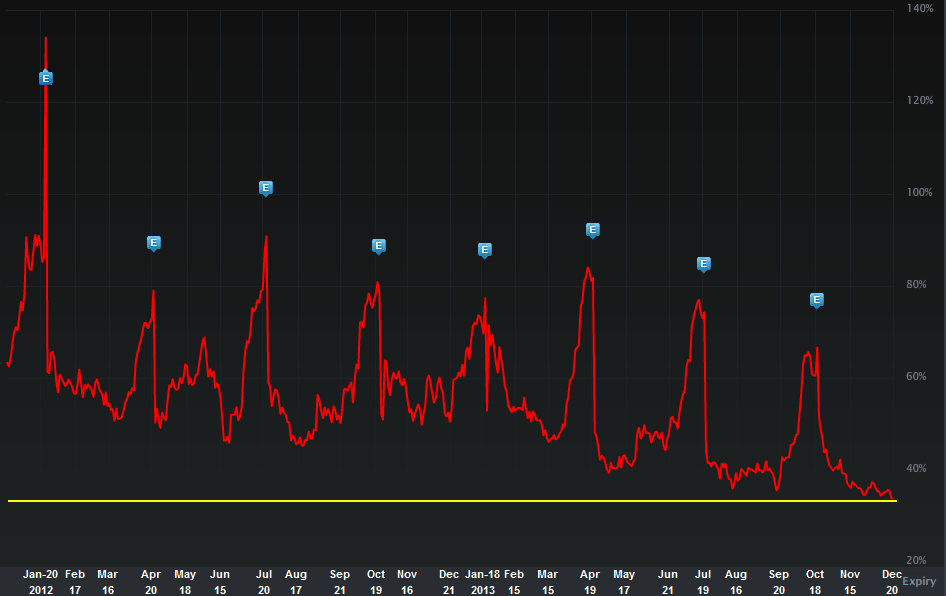
But the option market continues to tell a story that does not seem to be true.  And here it is... Let's turn to the two-year IV30™ chart below, in isolation.
Provided by Livevol

What we see how NFLX implied volatility continues to drop to new multi-year lows.  I have drawn that yellow horizontal line back two-years to illustrate the level of the current implied.  I wrote last time, there were two few mitigating factors:

1. The market wants to go up right now, it just does... So volatility (VIX) is low.
2. We're heading into Thanksgiving; a sleepy time not just for our grumbling tummies but also for the market at large.

But #2 isn't relevant anymore. The IV30™ is now based on Jan expiry.  And, yes, a part of Jan expiry covers Christmas / Hilidays, etc, but Jan expiry is Jan 18th.  That ain't the Holiday season anymore.

Last time I also wrote: "[H]ere's the fact that takes that mitigating factor stuff and throws it out the window.  Jan' 14 volatility is almost equally as depressed.  Yeah... it's true..."

Yeah, now we're in Jan expiry, and the vol is even lower.  I don't know if NFLX is going higher or lower, or if the market is going higher or lower, but this does not feel like a time when NFLX the company in and of itself is facing the lowest risk it has in the last several years.

Finally, let's turn to the Options Tab, for completeness.
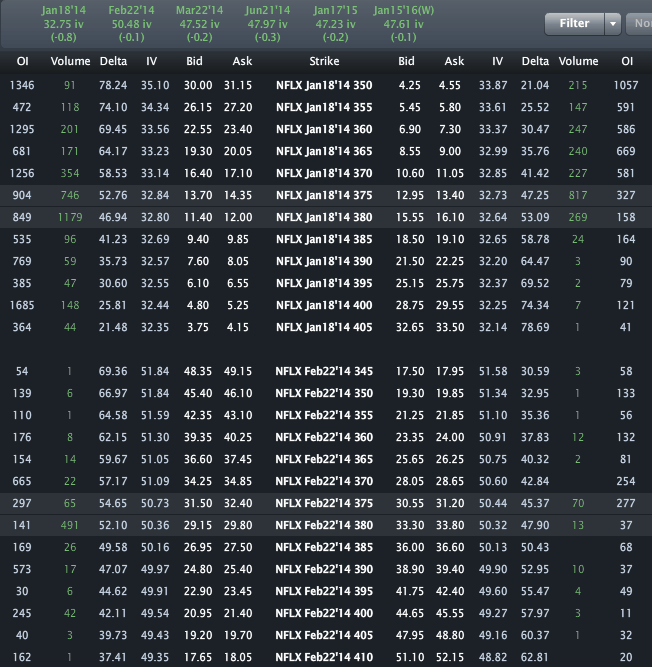
Provided by Livevol

We can see Jan'14 volatility is priced to 32.75% (the last post in November it was priced at 36.49%). We can see that Feb vol is considerably higher and that's due to earnings coming out at the end of Jan (but after Jan expiry).

Let's take one last look at volatility in a slightly different way -- this time, the skew.
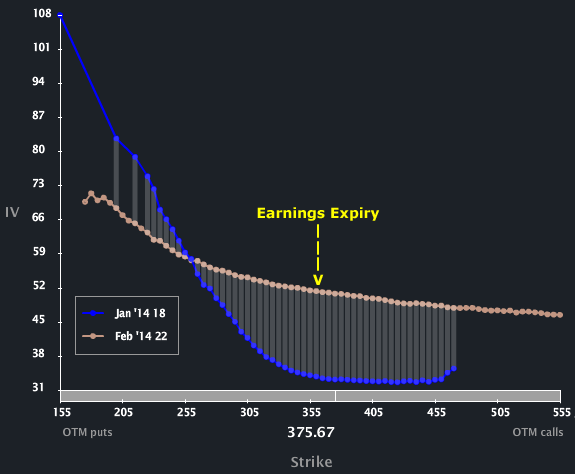

Provided by Livevol

Check out how differently Jan skew is shaped from from Feb skew.  Feb shows a much flatter shape, reflecting closer to an equal likelihood of an up move or a down move.  Watch that Jan/Feb skew difference.  The Feb calls are substantially more expensive (in terms of volatility).  If you believe Jan is truly a quiet period for NFLX (I mean a really quiet period), a calendar spread would off set a Feb call purchase but in the oddest way -- selling multi-year low vol to purchase elevated vol.  Not exactly options 101 trading, but hey, this is NFLX, we are way passed options 101 trading.

Please note, this is in no way advice or a recommendation. I'm pointing out facts. NO TRADES.

This is trade analysis, not a recommendation.


Legal Stuff:
Options involve risk. Prior to buying or selling an option, an investor must receive a copy of Characteristics and Risks of Standardized Options. Investors need a broker to trade options, and must meet suitability requirements.

The information contained on this site is provided for general informational purposes, as a convenience to the readers. The materials are not a substitute for obtaining professional advice from a qualified person, firm or corporation. Consult the appropriate professional advisor for more complete and current information. I am not engaged in rendering any legal or professional services by placing these general informational materials on this website.

I specifically disclaims any liability, whether based in contract, tort, strict liability or otherwise, for any direct, indirect, incidental, consequential, or special damages arising out of or in any way connected with access to or use of the site, even if I have been advised of the possibility of such damages, including liability in connection with mistakes or omissions in, or delays in transmission of, information to or from the user, interruptions in telecommunications connections to the site or viruses.

I make no representations or warranties about the accuracy or completeness of the information contained on this website. Any links provided to other server sites are offered as a matter of convenience and in no way are meant to imply that I endorse, sponsor, promote or am affiliated with the owners of or participants in those sites, or endorse any information contained on those sites, unless expressly stated.

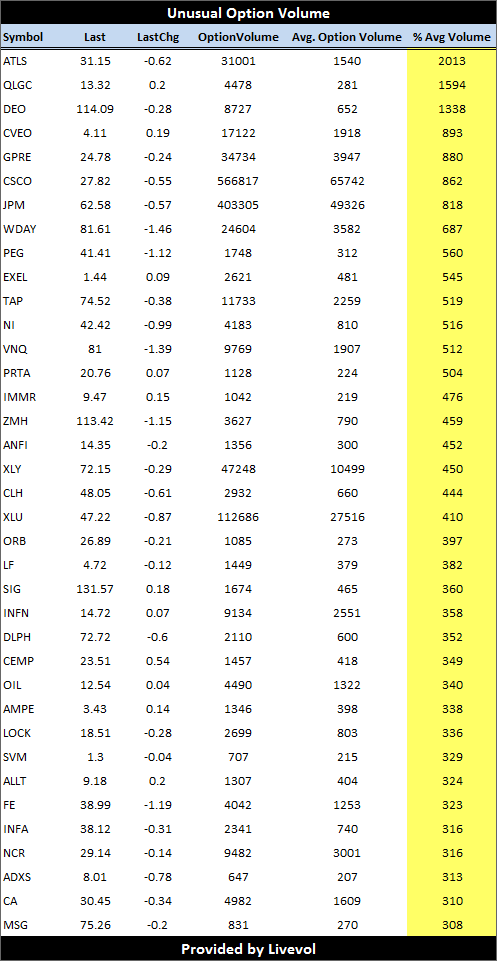
Thursday, December 26, 2013

12-26-2013: End of Day - Implied Volatility, Option Volume and Open Interest Movers


Names to watch in tomorrow's action...

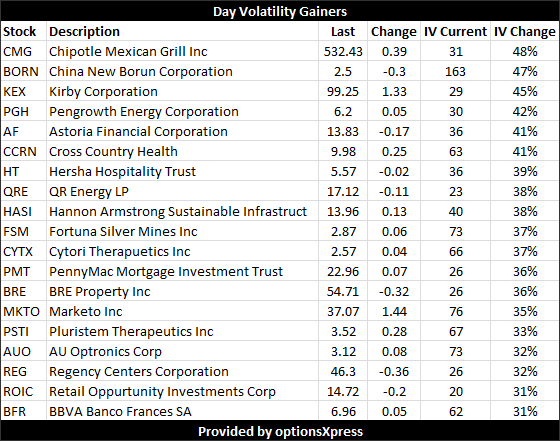
Unusual Volatility Moves

Provided by OptionsXpress

Unusual Option Volume

Provided by OptionsXpress

Unusual Open Interest (OI) Increases

Provided by OptionsXpress

This is trade analysis, not a recommendation.


Legal Stuff:
Options involve risk. Prior to buying or selling an option, an investor must receive a copy of Characteristics and Risks of Standardized Options. Investors need a broker to trade options, and must meet suitability requirements.

The information contained on this site is provided for general informational purposes, as a convenience to the readers. The materials are not a substitute for obtaining professional advice from a qualified person, firm or corporation. Consult the appropriate professional advisor for more complete and current information. I am not engaged in rendering any legal or professional services by placing these general informational materials on this website.

I specifically disclaim any liability, whether based in contract, tort, strict liability or otherwise, for any direct, indirect, incidental, consequential, or special damages arising out of or in any way connected with access to or use of the site, even if I have been advised of the possibility of such damages, including liability in connection with mistakes or omissions in, or delays in transmission of, information to or from the user, interruptions in telecommunications connections to the site or viruses.

I make no representations or warranties about the accuracy or completeness of the information contained on this website. Any links provided to other server sites are offered as a matter of convenience and in no way are meant to imply that I endorse, sponsor, promote or am affiliated with the owners of or participants in those sites, or endorse any information contained on those sites, unless expressly stated.
Google (GOOG) - Volatility Dipping; Has the Option Market Fallen into a Mistaken Malaise?


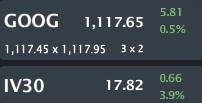
GOOG is trading $1,117.65 up 0.5% with IV30™ up 3.9%. The Symbol Summary is included below.

Provided by Livevol

Google Inc. (Google) is a global technology company. The Company’s business is primarily focused around key areas, such as search, advertising, operating systems and platforms, enterprise and hardware products.

This is a stock and volatility note.  I see some pretty low volatility in GOOG right now.  This is nowhere near the obvious mis-pricing we saw in TWTR two weeks ago, but it's worth a look.

To read the TWTR post, you click on the title, below:
Twitter (TWTR) - UPDATE: How the Option Market Totally Blew It, And We Knew it Two-Weeks Ago.

Let's start with the GOOG Charts Tab (two-years), below. The top portion is the stock price, the bottom is the vol (IV30™ - red vs HV20™ - blue vs HV180™ - pink).

Provided by Livevol

On the stock side we can see the incredible rise of what is now a gigantic firm and possibly the front runner for the first first firm to ever reach $1 trillion in market cap (but don't fall asleep on AAPL). In the last two-years GOOG has added ~$200 billion in market cap value.  I'm actually laughing as I write that it's such a big number... Very well done management.

Check out the gap on the last earnings release (the blue "E" icons represent earnings dates). GOOG popped from $888.79 to $ 1,011.41 or ~14% in one day. So what?... Well, there's a volatility story building here.

Let's turn to the two-year IV30™ chart in isolation, below.

Provided by Livevol

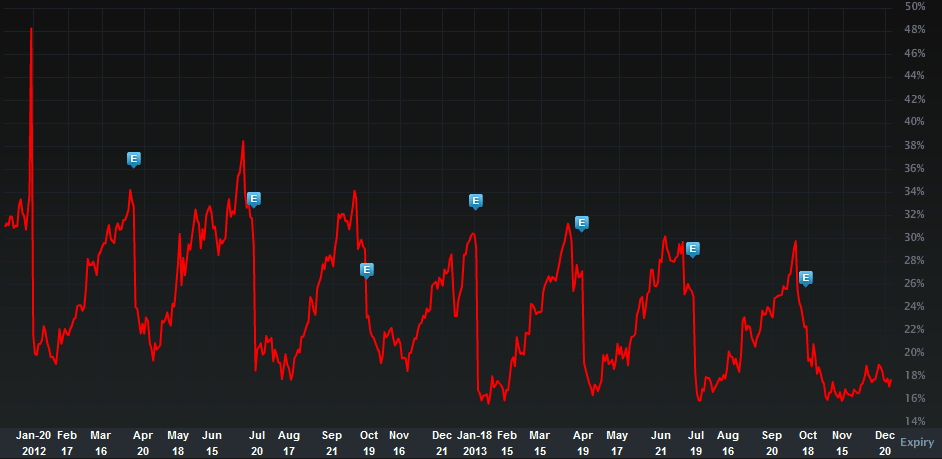
The rises and falls into and out of earnings (the blue "E" icons) are normal, but I find a little abnormal is the current level of the implied.  Right now GOOG's IV30™ sits in the 14th percentile on an annual basis.  Hmmm...

Now that red curve will rise into earnings which are due out in mid January, and if it follows the general pattern of the last two years, that peak will be lower than the prior peak.  But, last time that was incorrect -- which is to say, the option market mis-priced the risk in the shares and the stock gapped more than $120 in a day.

This follows a similar pattern I have been seeing in the option market overall, which is a general malaise in pricing risk. I recently posted an article entitled:
Just the Facts Ma'am: Is the United States in a Bubble? Does the United States Look Identical to Japan Right Now?

Whether or not the US is in a bubble, there is a question.. that is, there is a two-sided argument. If that's the case, then a behemoth cap that has seen a rise in market cap over two-years that in and of itself would make it a top ten company by size in the US, should probably not be seeing volatility levels in the 14th percentile.

Finally, the Options Tab is included below.

Provided by Livevol

Across the top we can see that Jan vol is priced to 16.69% and Feb vol is priced to 21.78%.  That vol difference is likely due to earnings, so potentially look for GOOG earnings to come out after Jan 18th (or so the option market seems to be pricing).

Watch GOOG.  Watch the market. Watch the volatility.  I don't think now is the time for malaise.  But I have been wrong before... many times...


This is trade analysis, not a recommendation.


Legal Stuff:
Options involve risk. Prior to buying or selling an option, an investor must receive a copy of Characteristics and Risks of Standardized Options. Investors need a broker to trade options, and must meet suitability requirements.

The information contained on this site is provided for general informational purposes, as a convenience to the readers. The materials are not a substitute for obtaining professional advice from a qualified person, firm or corporation. Consult the appropriate professional advisor for more complete and current information. I am not engaged in rendering any legal or professional services by placing these general informational materials on this website.

I specifically disclaims any liability, whether based in contract, tort, strict liability or otherwise, for any direct, indirect, incidental, consequential, or special damages arising out of or in any way connected with access to or use of the site, even if I have been advised of the possibility of such damages, including liability in connection with mistakes or omissions in, or delays in transmission of, information to or from the user, interruptions in telecommunications connections to the site or viruses.

I make no representations or warranties about the accuracy or completeness of the information contained on this website. Any links provided to other server sites are offered as a matter of convenience and in no way are meant to imply that I endorse, sponsor, promote or am affiliated with the owners of or participants in those sites, or endorse any information contained on those sites, unless expressly stated.
Twitter (TWTR) - UPDATE: How the Option Market Totally Blew It, And We Knew it Two-Weeks Ago.

This is a quick update to the post I published on 12-24-2013.

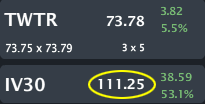
TWTR is trading $73.78, up 5.5% with IV30™ exploding up 53.1%. The Symbol Summary is included below.


Provided by Livevol

The entire prior post is included below.  The point simply is: Twitter (TWTR) - How the Option Market Totally Blew It, And We Knew it Two-Weeks Ago. (click on the link to read the post).

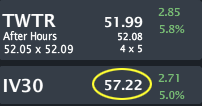
What you'll read below is that on 12-10-2013 TWTR options were priced to 57.22% volatility. I wrote a quick note on it and simply said: Twitter (TWTR) - Does The Option Market Have This One Wrong?

This was one of the greatest mispricings of volatility by the option market on a multi-billion dollar company that I have seen in several years.  The 57.22% volatility now stands at 111.25% and the stock has moved ~30%.  

The Prior post(s) are included below.
 
-----------------------------

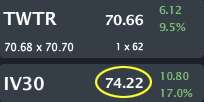
TWTR is trading $70.66, up 9.5% with IV30™ popping 17.0%. The Symbol Summary is included below.


Provided by Livevol

I last wrote about TWTR on 12-10-2013 (so, exactly two weeks ago).  That note had a very specific point which is evident in the title. The option market was completely wrong about this name.

I have included the post below -- you can read it by clicking on the title.
Twitter (TWTR) - Does The Option Market Have This One Wrong?

My basic premise was pretty simple, here is a snippet from that prior post as well as the Symbol Summary from that time (remember, this is from two weeks ago), note the level not just of the stock, but the volatility.

Provided by Livevol

------------------------
From 12-10-2013

TWTR's IV60™ and IV90™ are 60.53% and 62.06%.

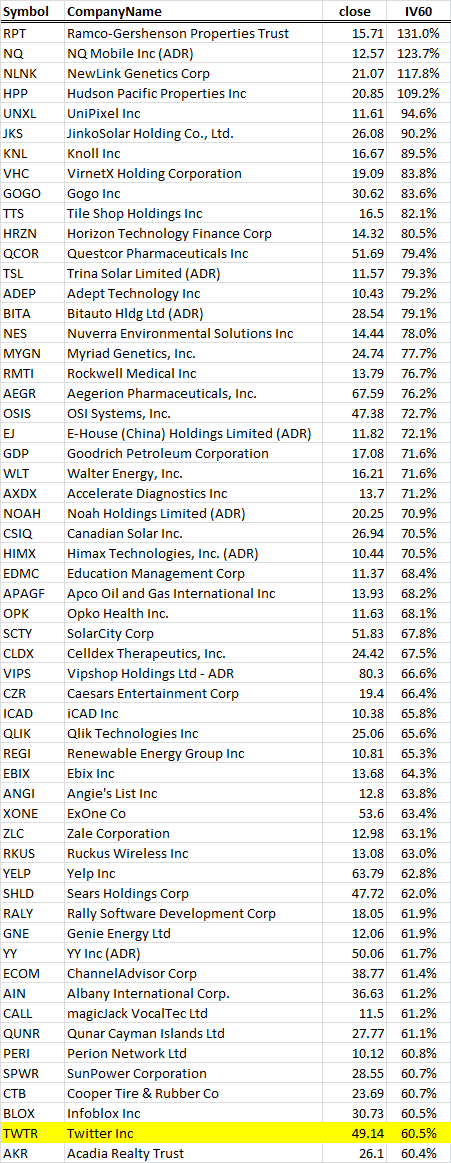
The company has earnings due out likely in Jan (possibly Feb expiry).  One quick question, did you know these firms all have higher 60-day implied volatilities than TWTR (and this excludes bio-techs)?


Provided by Livevol

Just to be clear, TWTR has lower vol than YELP (huh?) and TWTR has 30% lower vol than GOGO.

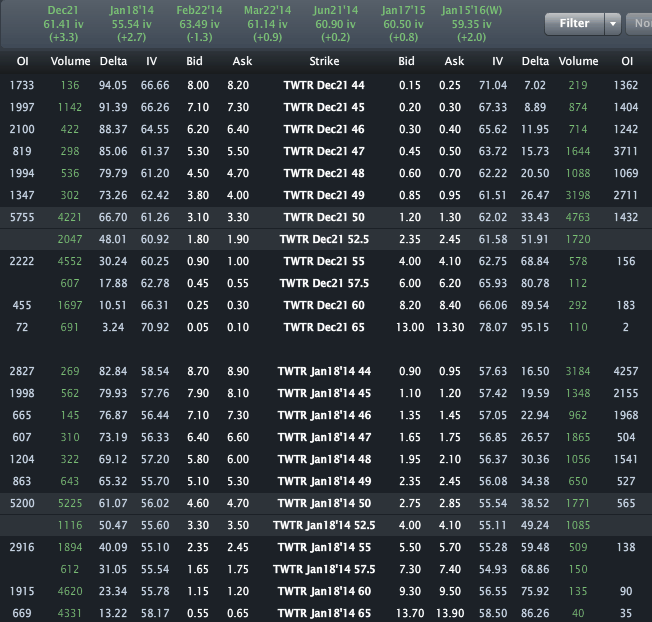
Let's see where this stock ends up, and take a snapshot (below) of what the option market reflects.


Provided by Livevol

Look at those ATM straddles... We'll re-visit in a month or two but for now the Option Market reads that TWTR will be in [$47.20, $54.65] on Jan 18. That feels like a tight price range... no?
------------------------

Back to today: 12-24-2013

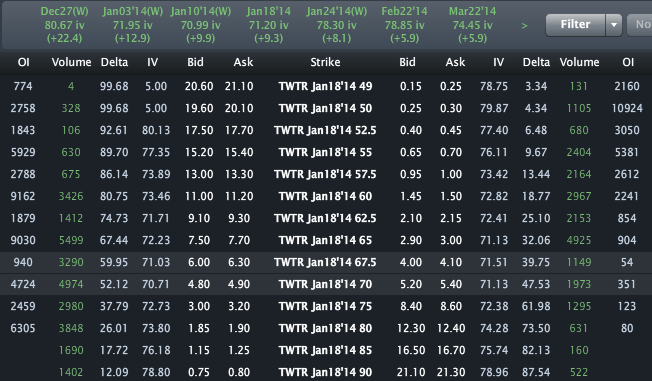
The Options Tab from today is included below.

Provided by Livevol

Bottom line, that [$47.20, $54.65] range has completely blown up with the stock now trading above $70.  Keep in mind, the argument presented two weeks ago was NOT that TWTR was going to go up, it was simply that the risk reflected by the option market was wrong.

That $7.40 straddle is now worth $18.00... and by the way, we're still in December.

This is trade analysis, not a recommendation.


Legal Stuff:
Options involve risk. Prior to buying or selling an option, an investor must receive a copy of Characteristics and Risks of Standardized Options. Investors need a broker to trade options, and must meet suitability requirements.

The information contained on this site is provided for general informational purposes, as a convenience to the readers. The materials are not a substitute for obtaining professional advice from a qualified person, firm or corporation. Consult the appropriate professional advisor for more complete and current information. I am not engaged in rendering any legal or professional services by placing these general informational materials on this website.

I specifically disclaim any liability, whether based in contract, tort, strict liability or otherwise, for any direct, indirect, incidental, consequential, or special damages arising out of or in any way connected with access to or use of the site, even if I have been advised of the possibility of such damages, including liability in connection with mistakes or omissions in, or delays in transmission of, information to or from the user, interruptions in telecommunications connections to the site or viruses.

I make no representations or warranties about the accuracy or completeness of the information contained on this website. Any links provided to other server sites are offered as a matter of convenience and in no way are meant to imply that I endorse, sponsor, promote or am affiliated with the owners of or participants in those sites, or endorse any information contained on those sites, unless expressly stated.