Monday, January 27, 2014

01-27-14: End of Day - New Highs/Lows, Implied Volatility Movers, Option Volume Movers, Elevated & Depressed IV/HV

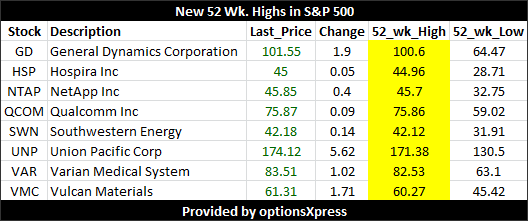
New 52 Wk Highs in S&P 500
No New Highs

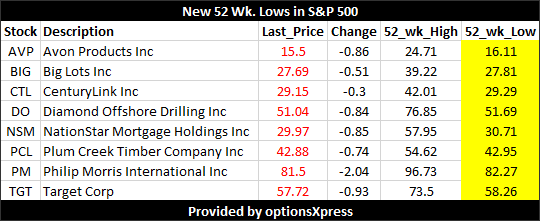
New 52 Wk Lows in S&P 500


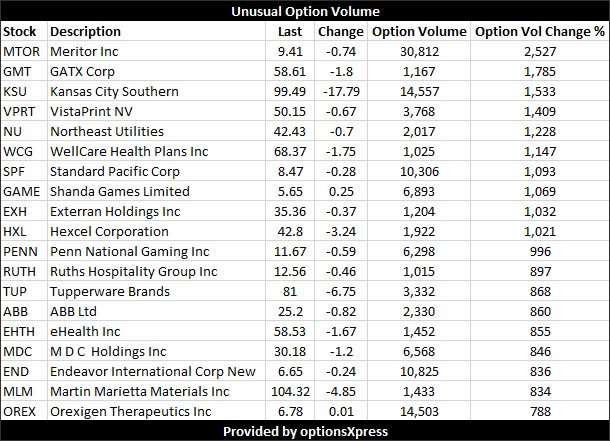
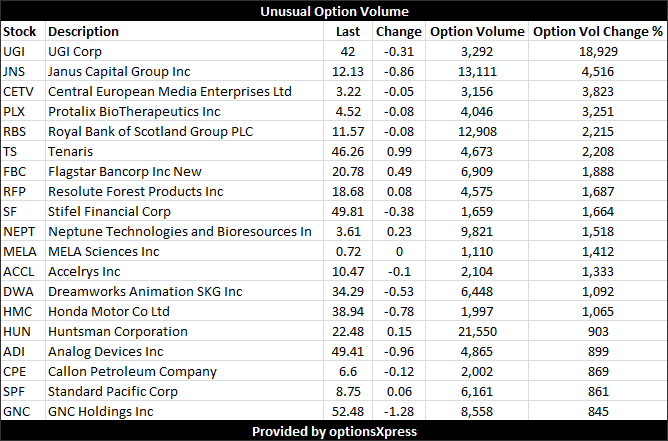
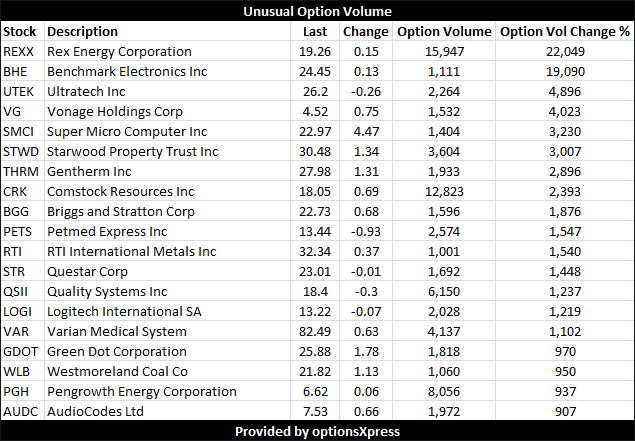
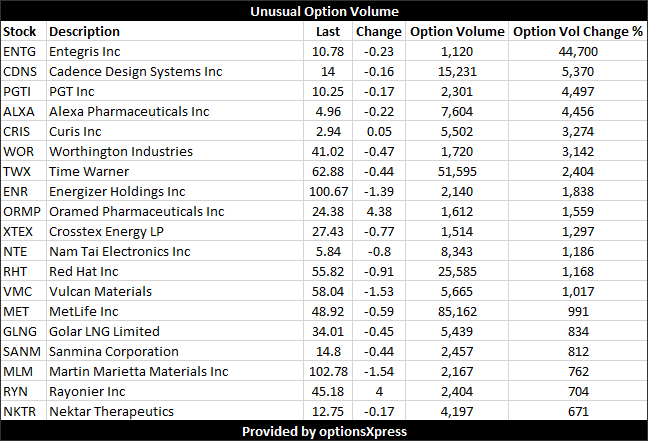
Unusual Option Volume


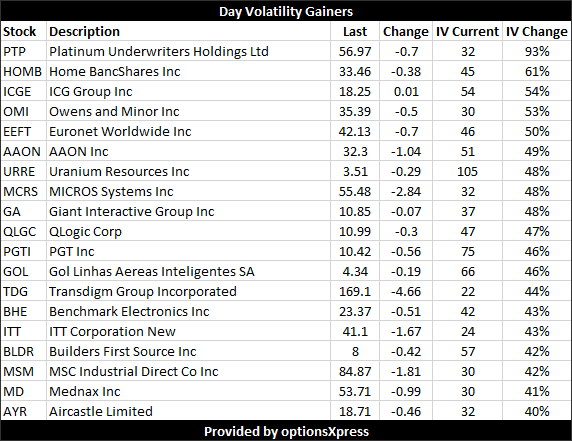
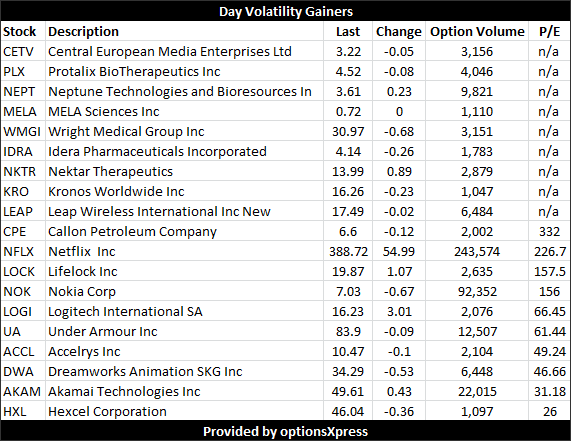
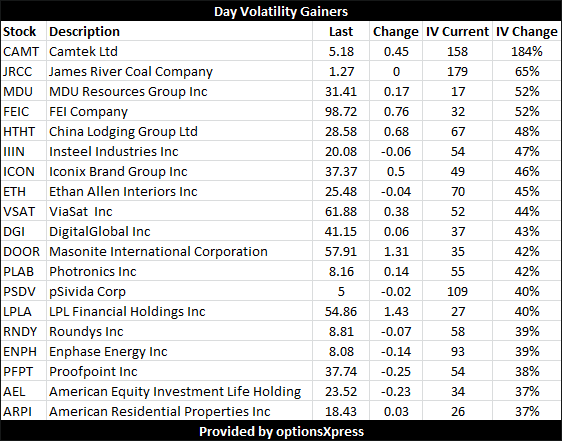
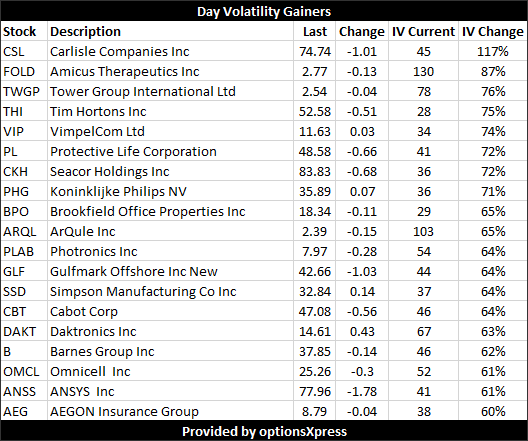
Unusual Volatility Moves


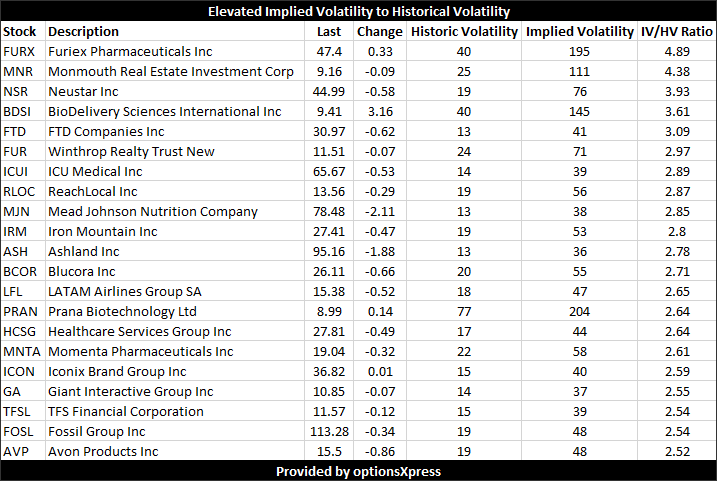
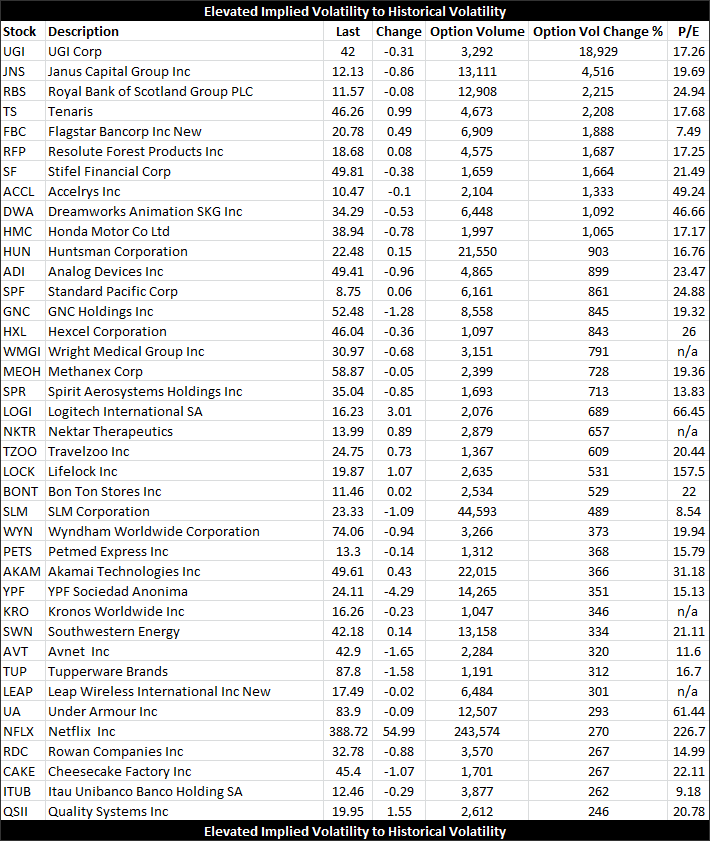
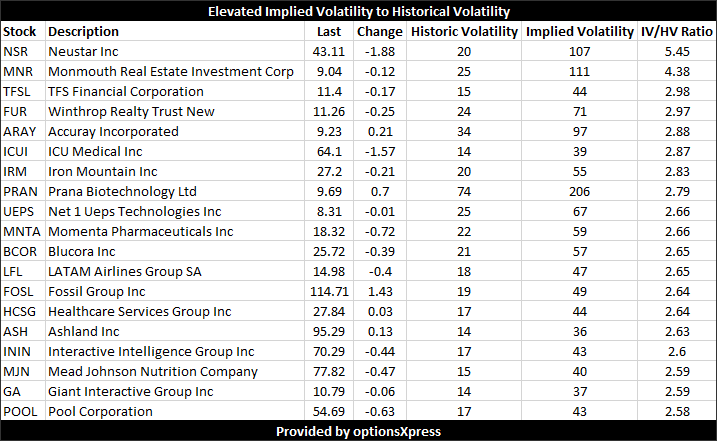
Elevated Implied Volatility (IV) to Historical Volatility (HV)


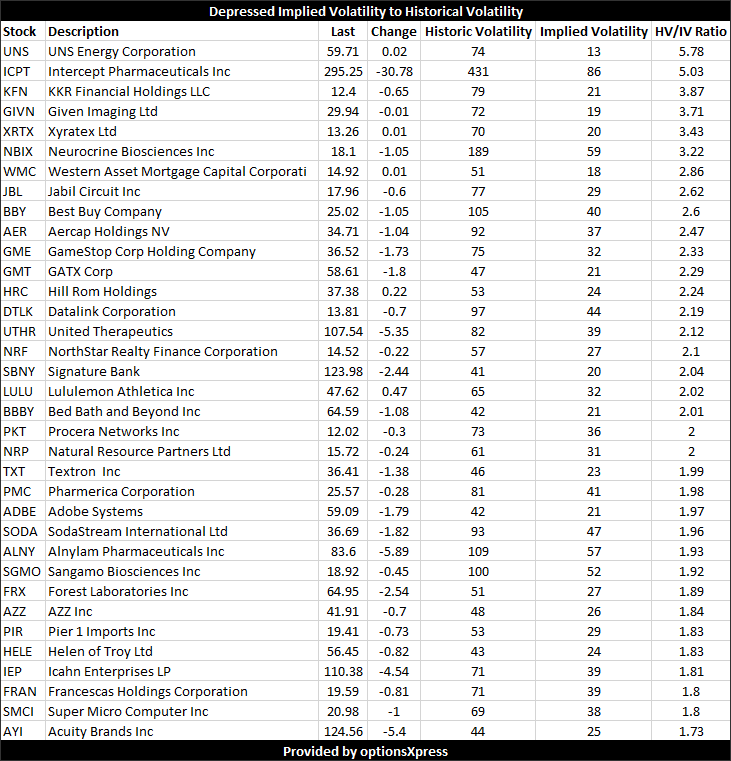
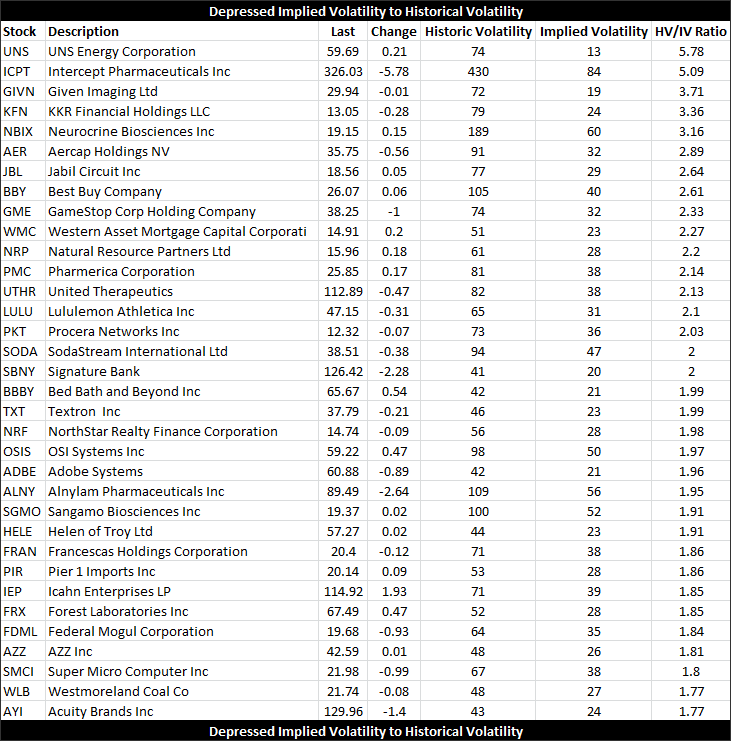
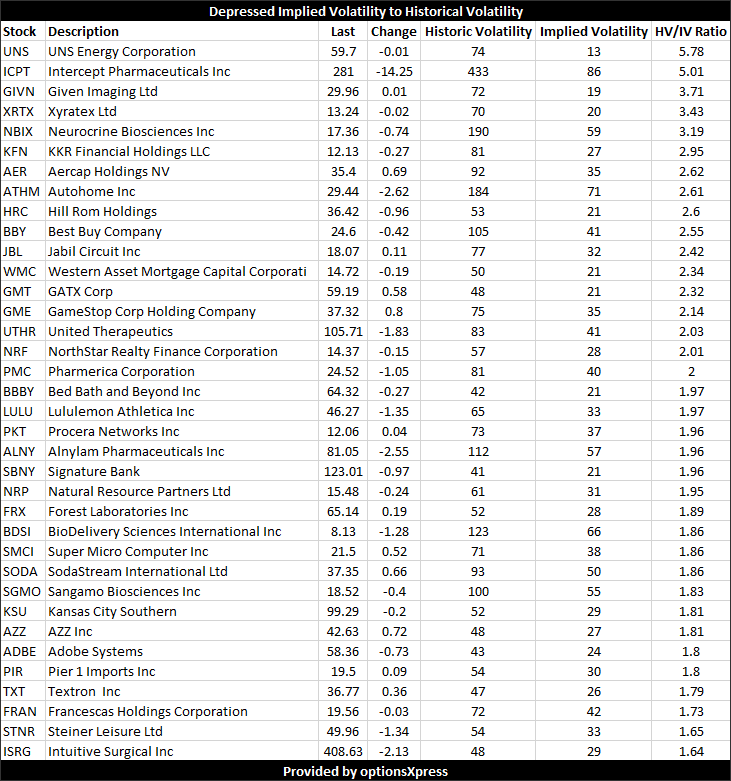
Depressed Implied Volatility (IV) to Historical Volatility (HV)


This is trade analysis, not a recommendation.


Legal Stuff:
Options involve risk. Prior to buying or selling an option, an investor must receive a copy of Characteristics and Risks of Standardized Options. Investors need a broker to trade options, and must meet suitability requirements.

The information contained on this site is provided for general informational purposes, as a convenience to the readers. The materials are not a substitute for obtaining professional advice from a qualified person, firm or corporation. Consult the appropriate professional advisor for more complete and current information. I am not engaged in rendering any legal or professional services by placing these general informational materials on this website.

I specifically disclaim any liability, whether based in contract, tort, strict liability or otherwise, for any direct, indirect, incidental, consequential, or special damages arising out of or in any way connected with access to or use of the site, even if I have been advised of the possibility of such damages, including liability in connection with mistakes or omissions in, or delays in transmission of, information to or from the user, interruptions in telecommunications connections to the site or viruses.

I make no representations or warranties about the accuracy or completeness of the information contained on this website. Any links provided to other server sites are offered as a matter of convenience and in no way are meant to imply that I endorse, sponsor, promote or am affiliated with the owners of or participants in those sites, or endorse any information contained on those sites, unless expressly stated.

Sunday, January 26, 2014

Apple (AAPL) - Earnings Preview: Has the Option Market Mis-priced the Risk in Earnings?


AAPL closed Friday trading at $546.07, down 1.8% with IV30™ up 7.1%. The Symbol Summary is included below.
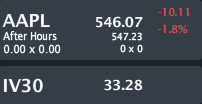
Provided by Livevol

I have written about AAPL extensively over the years and I highly recommend reading the older posts as we saw the firm literally change in front of our eyes from one firm to another with respect to risk as perceived by the market.

You can read any of the prior posts by clicking on the titles below. For a slightly quicker review, you can go to the last one listed (9-11-2013), which summarizes all of the prior posts (I have highlighted that one in yellow).

But today, I will focus on earnings and how the option market is pricing it... And there is a story...

--------

12-5-2012:
Apple (AAPL) - Have We Moved into a Totally New Volatility Paradigm for This Company? Has Everything Changed?

12-10-2012:
Apple (AAPL) - Everything has Changed. The Old AAPL is No More. The New AAPL is a Riskier Entity and the Market Doesn't Know What that Means Yet.

1-23-2013:
Apple (AAPL) - "Just the Facts Ma'am" -- Well, that Supports the Opinion: "Everything has Changed. The Old AAPL is No More."

4-18-2013:
Apple (AAPL) - This Just Isn't the Company it Used to Be... And it Never Will Be Again.

7-23-2013:
Apple (AAPL) - Earnings Preview Reveals Lots of Information; But There is No More 'Old AAPL' -- That's Not Good or Bad... It Just is.

7-29-2013:
Apple (AAPL) - Post Earnings Analysis; Risk Paradigm Shift Over; Now the Market Gets It

9-11-2013:
Apple (AAPL) - Part 7 (The End): This Just Isn't the Company it Used to Be... And it Never Will Be Again.

1-7-2014:
Apple (AAPL) - Earnings Preview and a Remarkable Risk Profile Change... For Now...

--------

Today: 1-26-2014

Just to be clear... really clear...

This is not advice.  This is analysis.  And... this is NOT Netflix.  I have no position in AAPL (unlike NFLX and TWTR at the time of those blogs).

We just got through an extraordinary examination of NFLX which looked very... very similar to how AAPL looks pre-earnings right now.  But, don't confuse the two! AAPL is an established giant, NFLX is a play on growth on top of growth. Two very different animals.

To read the extraordinary NFLX post and aftermath, you can click on the title below.  One of my favorites...

Netflix (NFLX) - Earnings Preview: "Less Risk in This Firm Now than In the Last Two-Years." Do You Agree? I'm Not Sure I Do.

And to read the wild mis-pricing of TWTR options, you can read this post:
Twitter (TWTR) - How the Option Market Totally Blew It, And We Knew it Two-Weeks Ago.

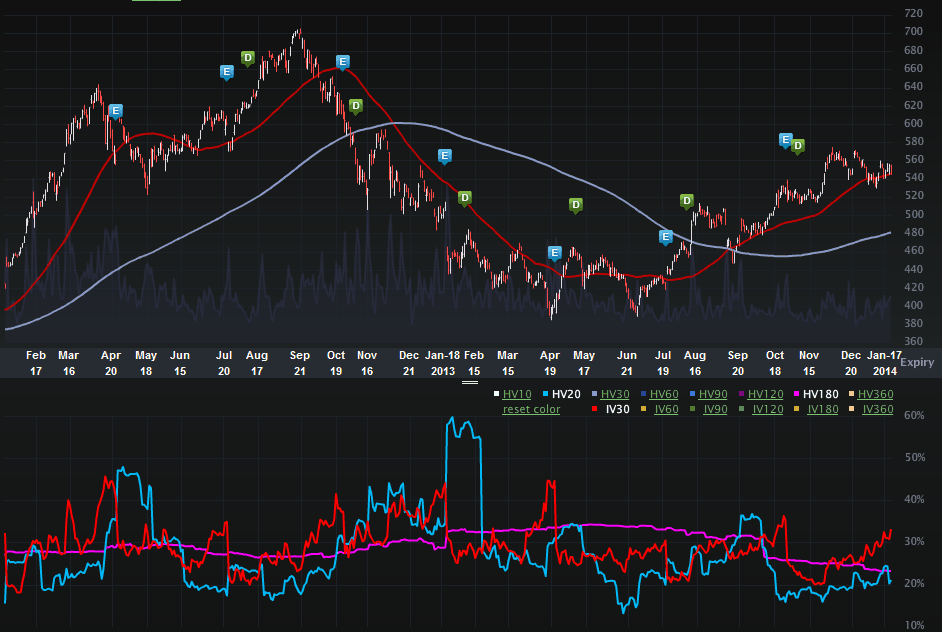
Let's start the AAPL analysis with the Charts Tab (two-years), below. The top portion is the stock price, the bottom is the vol (IV30™ - red vs HV20™ - blue vs HV180™ - pink).
Provided by Livevol

On the stock side we all know the story. The stock saw prices above $700, then prices below $400, and now we're in a relative equilibrium of ~$550.  AAPL is still the largest company in the world by market capitalization (by a lot) and the cash it has on hand is about the size of Citigroup's (C) entire market cap at ~ $150 billion.

But this is a volatility note based on earnings, and there is a lot to see -- both in the overall volatility and the skew. Let's turn to the IV30™ chart in isolation, below for the same time period (two-years).
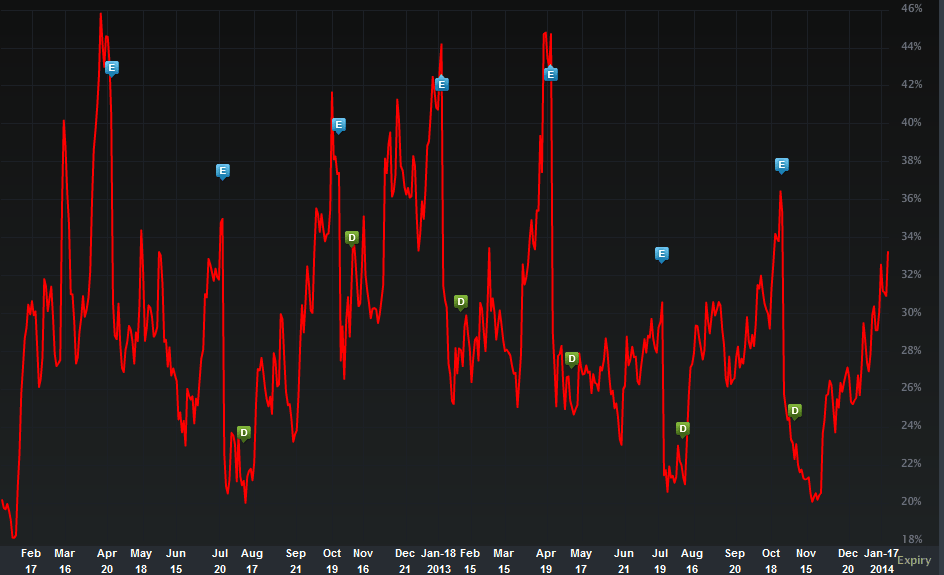
Provided by Livevol

The blue "E" icons represent earnings dates, which is where I want to focus. In fact, I want to focus on it so much, I have included the same chart below, with just the earnings date vols highlighted.
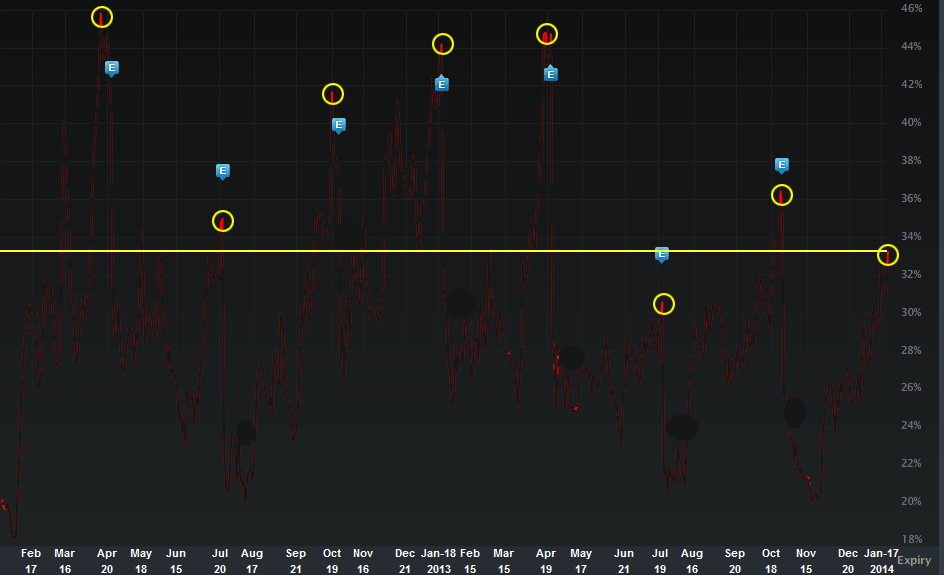

Provided by Livevol

What We See
The horizontal line I drew in makes it easier to see the current level of the implied (as of Sunday afternoon) relative to the last two-years.  And what do we see?...

The level of the implied volatility (i.e. the level of the risk reflected by the option market) for this earnings release is lower than six of the last seven events.  The last time volatility was below this level into earnings was the summer of 2013.  The stock moved from $418.99 to $440.51 in one day and the weekly options priced in a ~$19.50 move.  So, in English, the stock moved more than the risk the option market reflected, but it was not a wild mis-pricing -- in fact, it was pretty darn close.

But what about now?... Is the overall market different today then it was in July of last year?

Yes.

How about the overall risk in the market aka VIX.

7-23-2013: VIX spot closed at 12.66%
1-26-2014: VIX spot closed at 18.14%

So the VIX is 43% higher as of Friday's close than it was on 7-23-2013 (the last time earnings volatility for AAPL was below the current level).

So now the question becomes more complex: "Does AAPL have less earnings risk now in its shares than six of the last seven earnings and for the one outlier, should the risk be this low given that the VIX is 43% higher?"

I honestly don't know.  But the option market says: Yes.

I question that conclusion, but time will tell.

But there are some mitigating circumstances, namely, AAPL did release a report a little while back discussing sales in China and that report did show record sales. That report reduces risk, not because it was good (or bad), but because it reduced uncertainty.  This is a major red herring in the vol analysis.

But... that was a "a little while back." Also, AAPL is supposed to break new highs in China (iPhone 5C anyone?)... if the firm didn't break highs it would prove a cataclysmic failure.  The question is not if new revenue highs will be reached, but if those revenues will meet (or beat) expectations.

Remember a stock price is the present value of all future expected free cash flows (plus cash, debt etc). It's the expectations that matter.  So what are the expectations:

AAPL's guidance on revenue range is $55B - $58B for the quarter.  That's the top line.  I see estimates ranging from high $40's to low $60's... So, basically, no strong consensus around AAPL's guidance.

No consensus means risk on both sides, and guess what... The option market does reflect two tail risk.  Check out the Skew Tab, below.
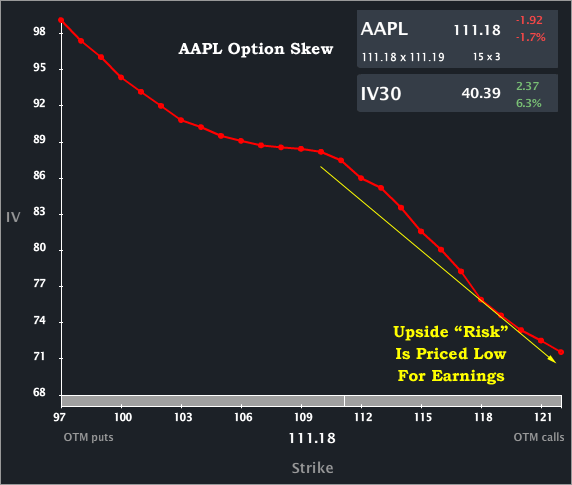
Provided by Livevol

We can see that for the three weekly expiries and Feb monthly (dark blue), all the option cycles show a parabolic skew where the option market reflects greater risk in the wings.  This skew shape is abnormal.

To read more about skew and what it id you can click on the title below:
Understanding Option Skew -- What it is and Why it Exists

So now we have a fascinating situation where the risk in AAPL shares as reflected by the option market is lower than six of the last seven earnings cycles while the VIX is substantially higher now than that one outlier when volatility was lower.  We have a small window into China sales due to a prior release (which should reduce the volatility i.e. uncertainty), but we also have a window into a slowing Chinese economy... and slowing may be an understatement.  The Eurozone is also growing much slower than anticipated (see Germany's last GDP report).

You can read an old post from more than a year ago about China here:
Has the Chinese Apocalypse Started? Is China on the Cusp of a Deflationary Vortex?

Let's look at the Options Tab as of the close Friday and see where AAPL ends up on Tuesday.  Will the option market price it nearly perfectly like in July of 2013, or... not...
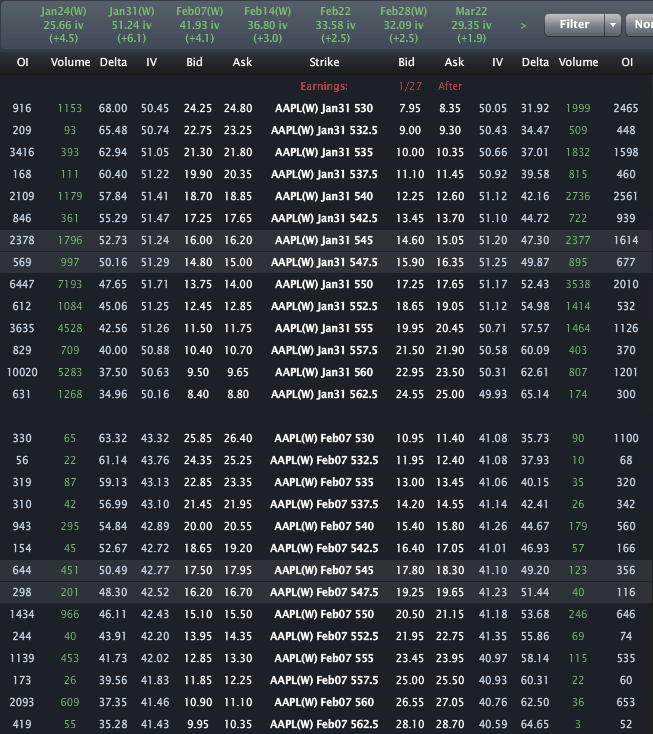

Provided by Livevol

The at-the-money ($545 strike) Jan 31 weekly options price a range of ~ [$515, $575] by the end of trading on Jan 30.  We'll see...

One last reminder... this is different than NFLX even though the vol set-up looks dangerously similar. The results may be the same (i.e. a huge move off of low implied volatility - a move which could be up or down), but the street is looking for totally different things from these two companies.

This is trade analysis, not a recommendation.


Legal Stuff:
Options involve risk. Prior to buying or selling an option, an investor must receive a copy of Characteristics and Risks of Standardized Options. Investors need a broker to trade options, and must meet suitability requirements.

The information contained on this site is provided for general informational purposes, as a convenience to the readers. The materials are not a substitute for obtaining professional advice from a qualified person, firm or corporation. Consult the appropriate professional advisor for more complete and current information. I am not engaged in rendering any legal or professional services by placing these general informational materials on this website.

I specifically disclaim any liability, whether based in contract, tort, strict liability or otherwise, for any direct, indirect, incidental, consequential, or special damages arising out of or in any way connected with access to or use of the site, even if I have been advised of the possibility of such damages, including liability in connection with mistakes or omissions in, or delays in transmission of, information to or from the user, interruptions in telecommunications connections to the site or viruses.

I make no representations or warranties about the accuracy or completeness of the information contained on this website. Any links provided to other server sites are offered as a matter of convenience and in no way are meant to imply that I endorse, sponsor, promote or am affiliated with the owners of or participants in those sites, or endorse any information contained on those sites, unless expressly stated.

Friday, January 24, 2014

01-24-14: End of Day - New Highs/Lows, Implied Volatility Movers, Option Volume Movers, Elevated & Depressed IV/HV


New 52 Wk Highs in S&P 500


New 52 Wk Lows in S&P 500


Unusual Option Volume


Unusual Volatility Moves


Elevated Implied Volatility (IV) to Historical Volatility (HV)


Depressed Implied Volatility (IV) to Historical Volatility (HV)


This is trade analysis, not a recommendation.


Legal Stuff:
Options involve risk. Prior to buying or selling an option, an investor must receive a copy of Characteristics and Risks of Standardized Options. Investors need a broker to trade options, and must meet suitability requirements.

The information contained on this site is provided for general informational purposes, as a convenience to the readers. The materials are not a substitute for obtaining professional advice from a qualified person, firm or corporation. Consult the appropriate professional advisor for more complete and current information. I am not engaged in rendering any legal or professional services by placing these general informational materials on this website.

I specifically disclaim any liability, whether based in contract, tort, strict liability or otherwise, for any direct, indirect, incidental, consequential, or special damages arising out of or in any way connected with access to or use of the site, even if I have been advised of the possibility of such damages, including liability in connection with mistakes or omissions in, or delays in transmission of, information to or from the user, interruptions in telecommunications connections to the site or viruses.

I make no representations or warranties about the accuracy or completeness of the information contained on this website. Any links provided to other server sites are offered as a matter of convenience and in no way are meant to imply that I endorse, sponsor, promote or am affiliated with the owners of or participants in those sites, or endorse any information contained on those sites, unless expressly stated.
Thursday, January 23, 2014

1-23-14: End of Day - New Highs/Lows, Implied Volatility Movers, Option Volume Movers, Elevated & Depressed IV/HV


New 52 Wk Highs in S&P 500


New 52 Wk Lows in S&P 500


Unusual Option Volume


Unusual Volatility Moves


Elevated Implied Volatility (IV) to Historical Volatility (HV)


Depressed Implied Volatility (IV) to Historical Volatility (HV)


This is trade analysis, not a recommendation.


Legal Stuff:
Options involve risk. Prior to buying or selling an option, an investor must receive a copy of Characteristics and Risks of Standardized Options. Investors need a broker to trade options, and must meet suitability requirements.

The information contained on this site is provided for general informational purposes, as a convenience to the readers. The materials are not a substitute for obtaining professional advice from a qualified person, firm or corporation. Consult the appropriate professional advisor for more complete and current information. I am not engaged in rendering any legal or professional services by placing these general informational materials on this website.

I specifically disclaim any liability, whether based in contract, tort, strict liability or otherwise, for any direct, indirect, incidental, consequential, or special damages arising out of or in any way connected with access to or use of the site, even if I have been advised of the possibility of such damages, including liability in connection with mistakes or omissions in, or delays in transmission of, information to or from the user, interruptions in telecommunications connections to the site or viruses.

I make no representations or warranties about the accuracy or completeness of the information contained on this website. Any links provided to other server sites are offered as a matter of convenience and in no way are meant to imply that I endorse, sponsor, promote or am affiliated with the owners of or participants in those sites, or endorse any information contained on those sites, unless expressly stated.
Netflix (NFLX) - Earnings Blowout; But the Story is Not Over. Stock is Still in Play.


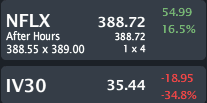
NFLX closed Thursday trading at $388.72, up 16.5% with IV30™ down 34.8% on earnings. The Symbol Summary is included below.


Provided by Livevol

This is a follow up to the two articles posted prior to NFLX earnings. You can read the prior posts by clicking on the titles. The article names in and of themselves summarize the content:

12-27-2013: 
Netflix (NFLX) - UPDATE: The Giant Killer is a Giant, But the Option Market is Still Asleep. What Happens When it Wakes Up?

1-21-2014: 
Netflix (NFLX) - Earnings Preview: "Less Risk in This Firm Now than In the Last Two-Years." Do You Agree? I'm Not Sure I Do.

The bottom line was that NFLX implied volatility (risk as reflected by the option market) was just too low.  we're talking well before earnings, and then the day before as well.

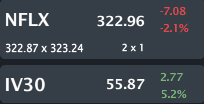
Here's how the Stock Symbol looked on 1-21-2014:

Provided by Livevol

But here's the thing.  This story isn't over IMHO.  The volatility collapsed today as it should after an earnings release.  But the vol was already ow (for earnings) as the 1-21-2014 article pointed out.  And now... The vol may be too low for a non-earnings period.

Check out the two-year IV30™ below.

Provided by Livevol

I have drawn in that yellow horizontal line backward right at the closing level today.  IV30™ is basically back to two-year lows.  You tell me.. With a stock that was $369 on 12-27, then $323 on 1-21 and now is $388.72 (an all-time high)... would you expect the option market to reflect the lowest risk over the last tow-years?..

Me either...

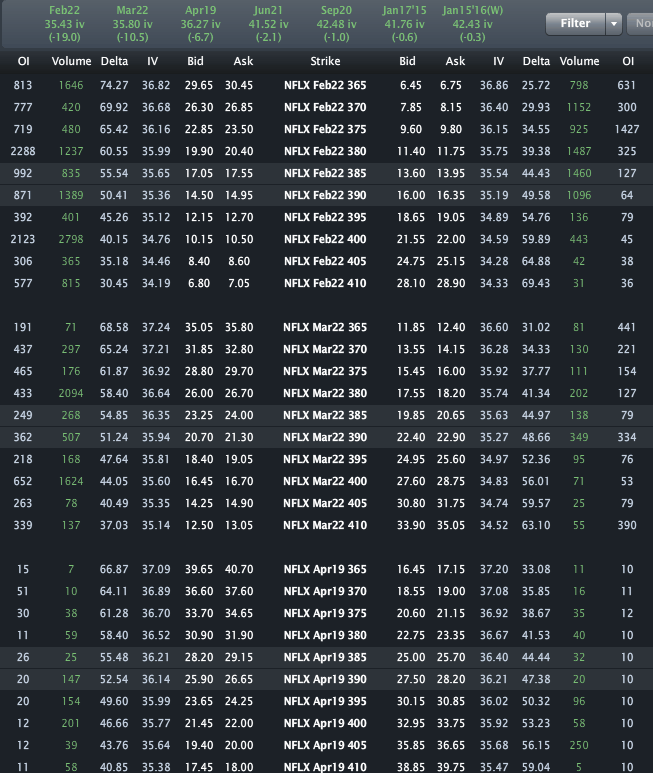
I have included the Options Tab below for completeness.

Provided by Livevol

Across the top we can see Feb, Mar and Apr vols are priced to 35.43%, 35.80% and 36.27%, respectively.  I guess we'll see...

This is trade analysis, not a recommendation.


Legal Stuff:
Options involve risk. Prior to buying or selling an option, an investor must receive a copy of Characteristics and Risks of Standardized Options. Investors need a broker to trade options, and must meet suitability requirements.

The information contained on this site is provided for general informational purposes, as a convenience to the readers. The materials are not a substitute for obtaining professional advice from a qualified person, firm or corporation. Consult the appropriate professional advisor for more complete and current information. I am not engaged in rendering any legal or professional services by placing these general informational materials on this website.

I specifically disclaim any liability, whether based in contract, tort, strict liability or otherwise, for any direct, indirect, incidental, consequential, or special damages arising out of or in any way connected with access to or use of the site, even if I have been advised of the possibility of such damages, including liability in connection with mistakes or omissions in, or delays in transmission of, information to or from the user, interruptions in telecommunications connections to the site or viruses.

I make no representations or warranties about the accuracy or completeness of the information contained on this website. Any links provided to other server sites are offered as a matter of convenience and in no way are meant to imply that I endorse, sponsor, promote or am affiliated with the owners of or participants in those sites, or endorse any information contained on those sites, unless expressly stated.
Herbalife (HLF) - Stock Gaps Down Hard; Volatility Explodes. But We Knew that a Week Ago, Right?


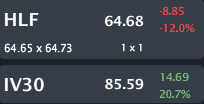
HLF is trading $64.68, down 12.0% with IV30™ exploding up 20.7%. The Symbol Summary is included below.


Provided by Livevol

This is a follow up to the article I posted on 1-17-2014 (six days ago). You can read that post by clicking on the title below:

Herbalife (HLF) - Volatility Rise Crosses Threshold... Is HLF at Risk... Again?

The bullet points of the prior blog were pretty simple:
----
"This is a vol note, specifically a rising vol note where I see the IV30™ breaching a level that in general has meant bad news for HLF. [] The 4.5% [volatility] pop [today has pushed the IV30™ above a threshold level for HLF"
----

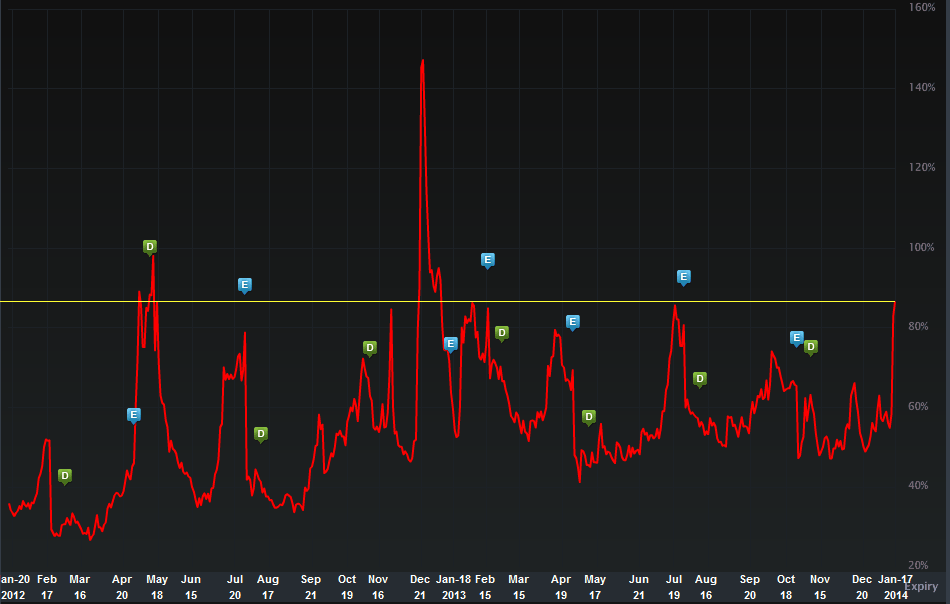
Well, it turns out that ~85% level was a key risk indicator (at least this time).  The volatility chart that drew the conclusion is included below.


Provided by Livevol

The prior note read:

---
We can see quite clearly how the implied has been rising as the stock has been dipping. But, note the level of the implied as of today's close. That 87% level was last breached on 12-20-2013, right in the middle of a stock drop from $45.68 down to $26.06 in just a few days.

We can even see that the level reached in the IV30™ is above the level of the last earnings release. But I think earnings shouldn't be out for another several weeks. Hmm...
---

Today, HLF is down 12%, and the implied has risen back to that threshold level.  Risk is here and getting realized in the stock price.

Here's the news today:
---
BOSTON, Jan 23 (Reuters) - Massachusetts Senator Edward Markey is asking for more information about the business practices of Herbalife Ltd, his office said on Thursday, making him the most prominent lawmaker to call for an investigation into claims the nutrition company is running a pyramid scheme.

Herbalife shares tumbled more than 12 percent after Markey, a Democrat, said he had written to the U.S. Securities and Exchange Commission (SEC), the Federal Trade Commission (FTC) and to Herbalife itself to try to obtain more information.

Source: Reuters via Yahoo! Finance Massachusetts Senator calls for probe into Herbalife, shares drop
---

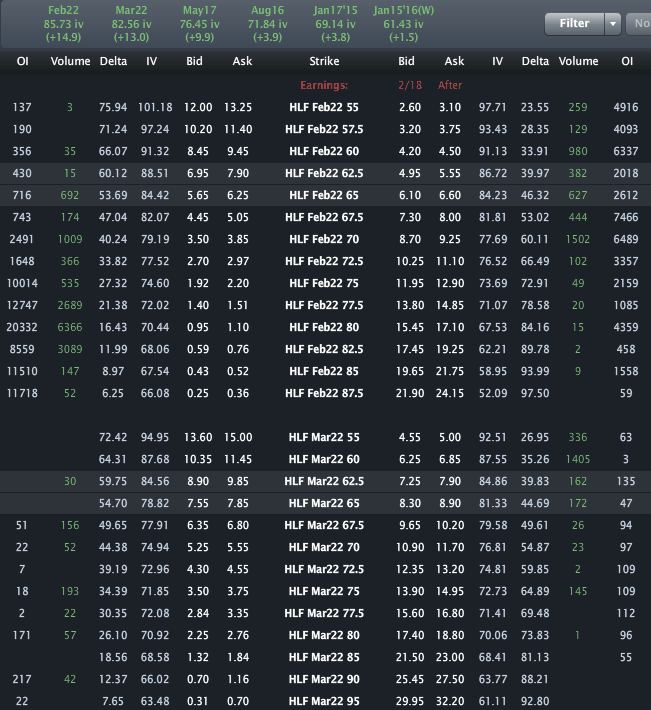
Finally, the Options Tab from today is included below.

Provided by Livevol

That's it... HLF is in flux and that threshold volatility is still in play.

This is trade analysis, not a recommendation.


Legal Stuff:
Options involve risk. Prior to buying or selling an option, an investor must receive a copy of Characteristics and Risks of Standardized Options. Investors need a broker to trade options, and must meet suitability requirements.

The information contained on this site is provided for general informational purposes, as a convenience to the readers. The materials are not a substitute for obtaining professional advice from a qualified person, firm or corporation. Consult the appropriate professional advisor for more complete and current information. I am not engaged in rendering any legal or professional services by placing these general informational materials on this website.

I specifically disclaim any liability, whether based in contract, tort, strict liability or otherwise, for any direct, indirect, incidental, consequential, or special damages arising out of or in any way connected with access to or use of the site, even if I have been advised of the possibility of such damages, including liability in connection with mistakes or omissions in, or delays in transmission of, information to or from the user, interruptions in telecommunications connections to the site or viruses.

I make no representations or warranties about the accuracy or completeness of the information contained on this website. Any links provided to other server sites are offered as a matter of convenience and in no way are meant to imply that I endorse, sponsor, promote or am affiliated with the owners of or participants in those sites, or endorse any information contained on those sites, unless expressly stated.

Wednesday, January 22, 2014

01-22-14: End of Day - New Highs/Lows, Implied Volatility Movers, Option Volume Movers, Elevated & Depressed IV/HV


New 52 Wk Highs in S&P 500


New 52 Wk Lows in S&P 500


Unusual Option Volume


Unusual Volatility Moves


Elevated Implied Volatility (IV) to Historical Volatility (HV)


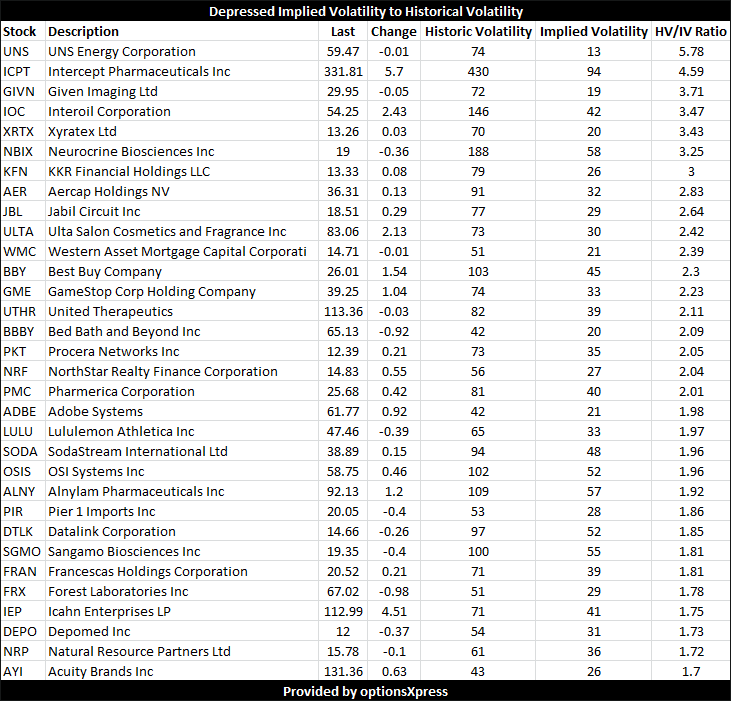
Depressed Implied Volatility (IV) to Historical Volatility (HV)


This is trade analysis, not a recommendation.


Legal Stuff:
Options involve risk. Prior to buying or selling an option, an investor must receive a copy of Characteristics and Risks of Standardized Options. Investors need a broker to trade options, and must meet suitability requirements.

The information contained on this site is provided for general informational purposes, as a convenience to the readers. The materials are not a substitute for obtaining professional advice from a qualified person, firm or corporation. Consult the appropriate professional advisor for more complete and current information. I am not engaged in rendering any legal or professional services by placing these general informational materials on this website.

I specifically disclaim any liability, whether based in contract, tort, strict liability or otherwise, for any direct, indirect, incidental, consequential, or special damages arising out of or in any way connected with access to or use of the site, even if I have been advised of the possibility of such damages, including liability in connection with mistakes or omissions in, or delays in transmission of, information to or from the user, interruptions in telecommunications connections to the site or viruses.

I make no representations or warranties about the accuracy or completeness of the information contained on this website. Any links provided to other server sites are offered as a matter of convenience and in no way are meant to imply that I endorse, sponsor, promote or am affiliated with the owners of or participants in those sites, or endorse any information contained on those sites, unless expressly stated.