Thursday, October 2, 2014

10-2-14: End of Day Report

Share on StockTwits


Top Headlines
* World waits on the Fed, the Fed waits on jobs

* Investors batten down hatches for volatile end to 2014

* Early October sell-off flashes buy signal

Top Laboratory Story
* Facebook (FB) - There is No Other Mega Cap Like it; Astonishing Visualizations

Open Interest
* Daily Open Interest Report

Covered Call
* Daily Covered Call Report

Biotech Index
* Daily Biotech Small & Micro Cap Update

Market Overview

Largest Stock Gainers


Largest Stock Losers


New 52 Wk Highs in S&P 500


New 52 Wk Lows in S&P 500


Unusual Option Volume


This is trade analysis, not a recommendation.


Legal Stuff:
Options involve risk. Prior to buying or selling an option, an investor must receive a copy of Characteristics and Risks of Standardized Options. Investors need a broker to trade options, and must meet suitability requirements.

The information contained on this site is provided for general informational purposes, as a convenience to the readers. The materials are not a substitute for obtaining professional advice from a qualified person, firm or corporation. Consult the appropriate professional advisor for more complete and current information. I am not engaged in rendering any legal or professional services by placing these general informational materials on this website.

I specifically disclaim any liability, whether based in contract, tort, strict liability or otherwise, for any direct, indirect, incidental, consequential, or special damages arising out of or in any way connected with access to or use of the site, even if I have been advised of the possibility of such damages, including liability in connection with mistakes or omissions in, or delays in transmission of, information to or from the user, interruptions in telecommunications connections to the site or viruses.

I make no representations or warranties about the accuracy or completeness of the information contained on this website. Any links provided to other server sites are offered as a matter of convenience and in no way are meant to imply that I endorse, sponsor, promote or am affiliated with the owners of or participants in those sites, or endorse any information contained on those sites, unless expressly stated.

10-2-14: Daily Biotech Small & Micro Cap Update

Share on StockTwits

The Ophir Gottlieb Small Cap Biotech Index
Is this the biotech revolution or the biotech bust?


Notable Stock Movers
XTLB+104.85%
GOVX+70.62%
ISCO+12.63%
AOBI-9.46%
PTLA-9.62%
ACUR-9.63%


Unusually Heavy Option Volume
ONTY:5042% of daily average
OPHT:673% of daily average
CPRX:584% of daily average

231 small / micro cap biotech and pharma companies (equal weighted):
  • Public Biotech and Pharma Companies
  • Trade on North American Exchanges
  • Market Cap Range: [$0, $2 Billion]
  • Price, Employees, Revenue Range: Any

More on index construction and performance: The Ophir Gottlieb Small Cap Biotech Index

Today's Biotech Index Stock Movers


Today's Biotech Index Unusual Option Volume


Full Index Constituents and Moves


This is trade analysis, not a recommendation.


Legal Stuff:
Options involve risk. Prior to buying or selling an option, an investor must receive a copy of Characteristics and Risks of Standardized Options. Investors need a broker to trade options, and must meet suitability requirements.

The information contained on this site is provided for general informational purposes, as a convenience to the readers. The materials are not a substitute for obtaining professional advice from a qualified person, firm or corporation. Consult the appropriate professional advisor for more complete and current information. I am not engaged in rendering any legal or professional services by placing these general informational materials on this website.

I specifically disclaim any liability, whether based in contract, tort, strict liability or otherwise, for any direct, indirect, incidental, consequential, or special damages arising out of or in any way connected with access to or use of the site, even if I have been advised of the possibility of such damages, including liability in connection with mistakes or omissions in, or delays in transmission of, information to or from the user, interruptions in telecommunications connections to the site or viruses.

I make no representations or warranties about the accuracy or completeness of the information contained on this website. Any links provided to other server sites are offered as a matter of convenience and in no way are meant to imply that I endorse, sponsor, promote or am affiliated with the owners of or participants in those sites, or endorse any information contained on those sites, unless expressly stated.

* Facebook (FB) - There is No Other Mega Cap Like it; Astonishing Visualizations


Share on StockTwits


This visualization is provided by: Capital Market Laboratories (join the queue for a trial)

FB is trading $77.38, up 1.1% with IV30™ up 2.5%. The Symbol Summary is included below.

Provided by Livevol

Conclusion
Facebook is a remarkable company, or at the very least, a remarkable stock.  The growth figures are absolutely off the chart (practically) for a firm this large (in market cap).  I'm no there to argue bull or bear (or anything in between), I simply want to show you how unbelievable this firm looks through the lens of visual data.  If you don't have this at your finger tips... why not?  Free trial is available up top.  Get the tool the pros have access to... I do.


So this is the picture of all pictures... the one that paints a billion words, not just a thousand.  I have included the mega caps ($100B and larger) in North America excluding the bio-techs.  On the x-axis we have revenue growth (1-year), and on the y-axis we have earnings growth (1-year).  Quite simply, there is FB... and everybody else.


Click Here for Full Size Image


Now let's turn to some company specific measures before making one last giant comparison.

Total Revenue (TTM)
FB revenue has grown from under $4B to now over $10B (trailing-twelve-months).  While we see firms more than doubling revenue over the same frame, we're usually looking at hundreds of millions... This is insane growth for a firm with numbers this large.


Gross Margin %
When a firm has exploding revenue, I like to keep an eye on the consistency of gross margins.  For FB, the immensely high gross margin % of over 80% has been steady as revenue has grown... In fact, gross margin % has grown.


Net Income (TTM)
This is the mark Zuckerberg chart.  When FB went pubic people were "undecided" on whole regarding this "kid's" ability to lead a multi-billion dollar public firm.  Earnings dropped as did the stock (though not as abruptly) at the start... The overall sentiment surrounding Zuckerberg had changed from "undecided" to decidedly negative... Then the last two-year s happened.  FB grew earnings from basically $0 to now just under $2.5B (trailing-twelve-months)....

Now Zuckerberg sentiment has swung to decidedly... genius?


Gross Margin % Comp to Peers
It's interesting to compare FB gross margin % to some peers... There are some crazy outliers, like YELP and Zillow, bit for the most part, for a firm this enormous, gross margin % is simply remarkable.


Revenue Growth vs. Earnings Growth 
When we plot earnings growth (one-year) on the y-axis and revenue growth on the x-axis for a group of peers in the Internet Software & Services industry, we can see that FB has the largest earnings growth, and the third largest revenue growth.  keep in mind, this is a $200B market cap firm... it has "no business growing as fast as small caps."


That's it... If you want to do this analysis yourself on any company in the world... send us an e-mail through this page:
Capital Market Laboratories (join the queue for a trial)


This is trade analysis, not a recommendation.


Legal Stuff:
Options involve risk. Prior to buying or selling an option, an investor must receive a copy of Characteristics and Risks of Standardized Options. Investors need a broker to trade options, and must meet suitability requirements.

The information contained on this site is provided for general informational purposes, as a convenience to the readers. The materials are not a substitute for obtaining professional advice from a qualified person, firm or corporation. Consult the appropriate professional advisor for more complete and current information. I am not engaged in rendering any legal or professional services by placing these general informational materials on this website.

I specifically disclaim any liability, whether based in contract, tort, strict liability or otherwise, for any direct, indirect, incidental, consequential, or special damages arising out of or in any way connected with access to or use of the site, even if I have been advised of the possibility of such damages, including liability in connection with mistakes or omissions in, or delays in transmission of, information to or from the user, interruptions in telecommunications connections to the site or viruses.

I make no representations or warranties about the accuracy or completeness of the information contained on this website. Any links provided to other server sites are offered as a matter of convenience and in no way are meant to imply that I endorse, sponsor, promote or am affiliated with the owners of or participants in those sites, or endorse any information contained on those sites, unless expressly stated.

10-2-14: Daily Open Interest Report

Share on StockTwits


Daily Option Interest Report

Notable One-day Option Position Increases
RCPT+855%
PSXP+813%
BNFT+741%
Full List Below


Notable Large Option Position Increases Relative to 3-month Average
BAGL+1108%
VIMC+596%
CLDT+502%
Full List Below

Largest One-day Open Interest Increases


Largest Current Open Interest Relative to 90-day Average


This is trade analysis, not a recommendation.


Legal Stuff:
Options involve risk. Prior to buying or selling an option, an investor must receive a copy of Characteristics and Risks of Standardized Options. Investors need a broker to trade options, and must meet suitability requirements.

The information contained on this site is provided for general informational purposes, as a convenience to the readers. The materials are not a substitute for obtaining professional advice from a qualified person, firm or corporation. Consult the appropriate professional advisor for more complete and current information. I am not engaged in rendering any legal or professional services by placing these general informational materials on this website.

I specifically disclaim any liability, whether based in contract, tort, strict liability or otherwise, for any direct, indirect, incidental, consequential, or special damages arising out of or in any way connected with access to or use of the site, even if I have been advised of the possibility of such damages, including liability in connection with mistakes or omissions in, or delays in transmission of, information to or from the user, interruptions in telecommunications connections to the site or viruses.

I make no representations or warranties about the accuracy or completeness of the information contained on this website. Any links provided to other server sites are offered as a matter of convenience and in no way are meant to imply that I endorse, sponsor, promote or am affiliated with the owners of or participants in those sites, or endorse any information contained on those sites, unless expressly stated.

10-2-14: Daily Covered Call Report

Share on StockTwits


Requirements
  • 1 million+ shares average daily volume
  • IV > 10%
  • IV < 60% 
  • Static Return (unassigned) > 5%

This information is available via optionsXpress ---> Idea Hub


This is trade analysis, not a recommendation.


Legal Stuff:
Options involve risk. Prior to buying or selling an option, an investor must receive a copy of Characteristics and Risks of Standardized Options. Investors need a broker to trade options, and must meet suitability requirements.

The information contained on this site is provided for general informational purposes, as a convenience to the readers. The materials are not a substitute for obtaining professional advice from a qualified person, firm or corporation. Consult the appropriate professional advisor for more complete and current information. I am not engaged in rendering any legal or professional services by placing these general informational materials on this website.

I specifically disclaim any liability, whether based in contract, tort, strict liability or otherwise, for any direct, indirect, incidental, consequential, or special damages arising out of or in any way connected with access to or use of the site, even if I have been advised of the possibility of such damages, including liability in connection with mistakes or omissions in, or delays in transmission of, information to or from the user, interruptions in telecommunications connections to the site or viruses.

I make no representations or warranties about the accuracy or completeness of the information contained on this website. Any links provided to other server sites are offered as a matter of convenience and in no way are meant to imply that I endorse, sponsor, promote or am affiliated with the owners of or participants in those sites, or endorse any information contained on those sites, unless expressly stated.

Wednesday, October 1, 2014

* Herbalife (HLF) - Not Billionaires' Arguments Driving the Stock. It's Something Much, Much Bigger.


Share on StockTwits


This visualization is provided by: Capital Market Laboratories (join the queue for a trial)

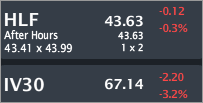
HLF closed Wednesday trading at $43.63, down small with IV30™ down 3.2%. The Symbol Summary is included below.

Provided by Livevol

Conclusion
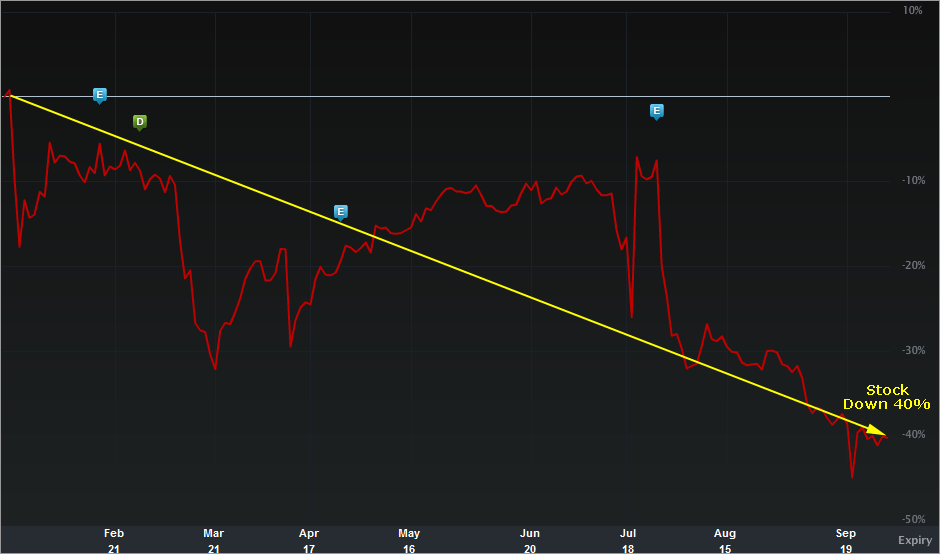
HLF is down 40% since it's peak in January of 2014, and while the headlines have been Bill Ackman vs. Carl Ichan, there's something else that's going on with the company... and that "something" may very well be driving the stock price.

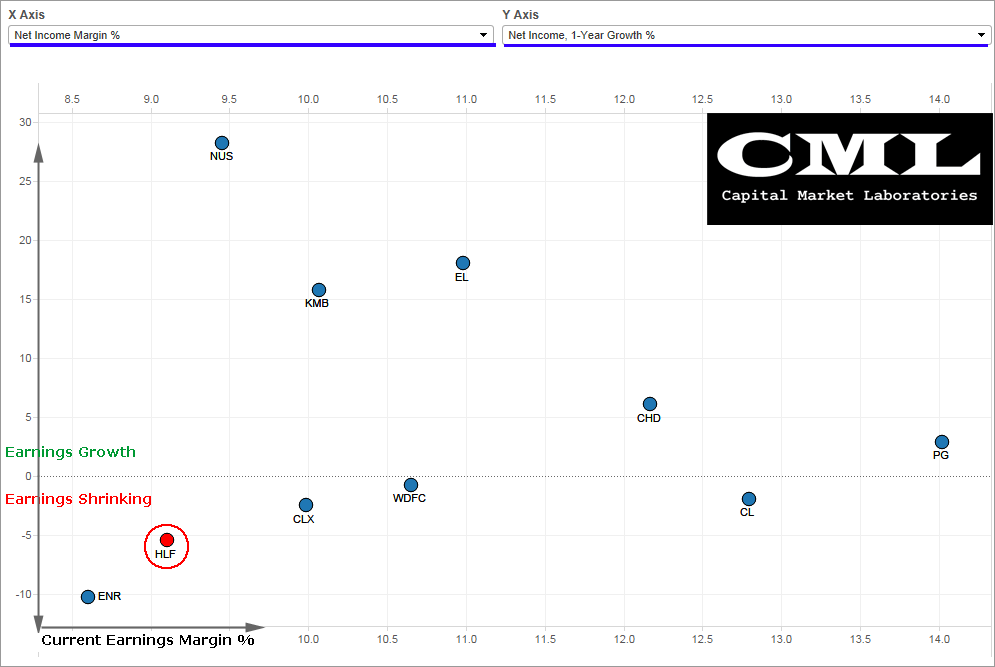
HLF has the second worst net income shrinkage (one-year) and the second worst earnings margin % relative to peers.


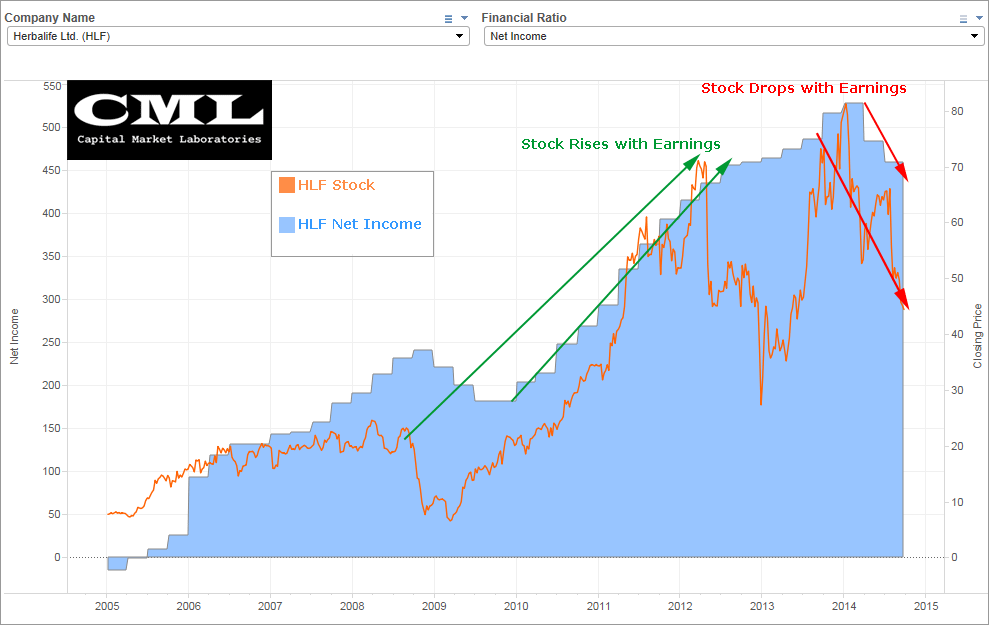
We'll look at four financial measures, with trends and some peer comparisons, but here's the Pièce de résistance.  The chart below shows HLF stock price is orange and net income (earnings) in blue.


Before we dig deeper into the financial measures, let's look at the stock chart from January 21st (stock peak in 2014) to the present.

Provided by Livevol

We can see the stock has had some ups and down, but bottom line: it's down 40% from its peak... and it ain't Bill Ackman and Carl Icahn that are moving the price over the long-term.

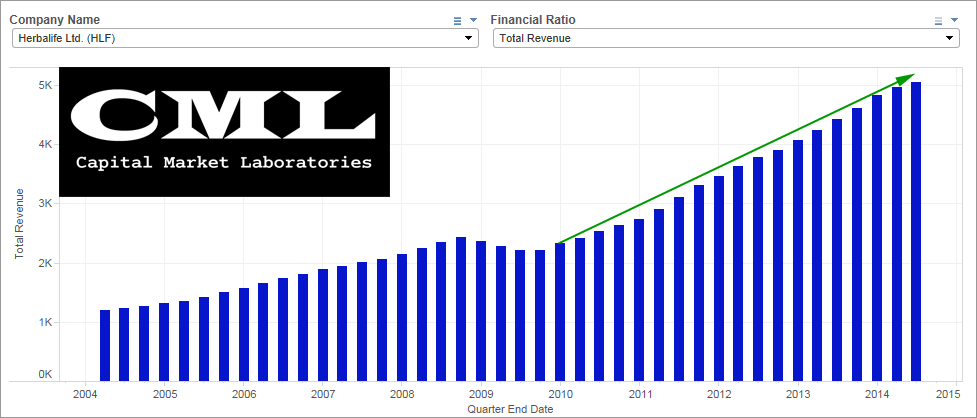
Total Revenue (TTM)
So this is a beautiful chart... and the one bulls will point to (quite rightly).  Revenue growth has been spectacular and consistent... has it been too "consistent?


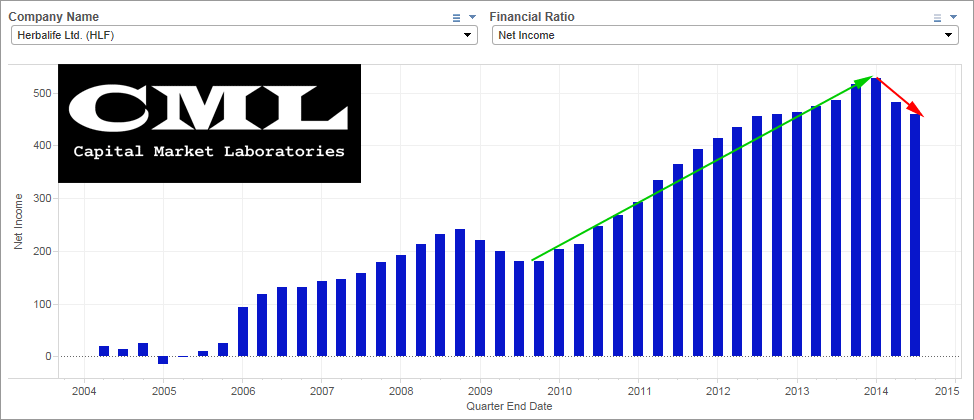
Net Income (TTM)
Earnings have been rising abruptly for HLF from essentially a break even firm back in 2005 to a firm with over half a billion dollars in net income.  But... we see a down trend.


Now, these are trailing-twelve-month composites so the trend isn't so cut and dry.  here are the last four quarters of net income from the most recent to the least, respectively.
Q2 2014: $120M
Q1 2014: $75M
Q4 2013: $126M
Q3 2014: $142M

So it's not a straight line, but the last two quarters are lower than any of the two quarters prior.

Net Income Margin %
This is a more indicative measure since the downtrend has lasted well over two-years.  The bottom line is, HLF earnings margins are decreasing even though revenue are increasing.


Net Income vs. Net Income Margin %
So far everything we've looked at has been in a vacuum... which is to say, it has been focused on HLF alone.  If we plot Net Income Margin % on the x-axis and Net Income Growth (1-year) on the y-axis, and allow the scatter to include HLF's peers, we see the problem.  HLF has the second worst net income shrinkage (one-year) and the second worst earnings margin %.


Billionaires may agree to disagree... but a firm with shrinking earnings and poor margins doesn't need investors famous for being rich to do anything... it needs a turnaround in the company's operations.

This is trade analysis, not a recommendation.


Legal Stuff:
Options involve risk. Prior to buying or selling an option, an investor must receive a copy of Characteristics and Risks of Standardized Options. Investors need a broker to trade options, and must meet suitability requirements.

The information contained on this site is provided for general informational purposes, as a convenience to the readers. The materials are not a substitute for obtaining professional advice from a qualified person, firm or corporation. Consult the appropriate professional advisor for more complete and current information. I am not engaged in rendering any legal or professional services by placing these general informational materials on this website.

I specifically disclaim any liability, whether based in contract, tort, strict liability or otherwise, for any direct, indirect, incidental, consequential, or special damages arising out of or in any way connected with access to or use of the site, even if I have been advised of the possibility of such damages, including liability in connection with mistakes or omissions in, or delays in transmission of, information to or from the user, interruptions in telecommunications connections to the site or viruses.

I make no representations or warranties about the accuracy or completeness of the information contained on this website. Any links provided to other server sites are offered as a matter of convenience and in no way are meant to imply that I endorse, sponsor, promote or am affiliated with the owners of or participants in those sites, or endorse any information contained on those sites, unless expressly stated.