Wednesday, July 9, 2014

* Google (GOOG) - Earnings Preview: Something We Haven't Seen in 2-years. Did You Know This?

Share on StockTwits

GOOG is trading $575.74, up 0.8% with IV30™ down 2.2%. The Symbol Summary is included below.

Provided by Livevol

This is an earnings and volatility (risk of earnings) note.

Conclusion
The risk as reflected by the option market in the GOOG stock price is lower now than it has been in any of the prior seven quarters.  Further, prior to this event, the last three earnings cycles actually showed continually increasing risk and all of a sudden we see a dramatic drop in that risk for this earnings release.


The two-year stock chart for GOOG (GOOGL) is included below.

Provided by Charles Schwab optionsXpress

There are really three parts to this chart.
1. A rise of more than 100% in less than two-years to an all-time high above $600.
2. A drop from the all-time high that was abrupt (~10%) but short-lived.
3. The rise from that dip into a range in between the all-time high and the short-term low.

As the chart asks, "what now?"  I really wish I could tell you, but I can't... But, I can tell you this...

Let's turn to the IV30™ chart in isolation, below.

Provided by Livevol

The implied volatility is the forward looking risk in the equity price as reflected by the option market (IV30™ looks forward exactly 30 calendar days).

While the current level of the risk (the red curve) seems right about middle of the road, that is easily deceiving.  What we really need to look at is the level of risk relative to the last earnings cycles (the blue E" icons represent earnings).

Let's take the same chart and only focus on the peaks of volatility into (before) earnings events.

Provided by Livevol

And now we see a totally different story.  The implied volatility (the forward looking risk into earnings) is actually below all of the prior earnings releases in this chart.

There is one caveat, which surrounds timing.  GOOG isn't set to report earnings until 7-17-2014 after market close.  That means we still have a week (ish) before the event.  The level of the risk will almost certainly rise as we approach that earnings date, so we are taking a slightly early look.

It's quite possible that the yellow circle (the current risk) will pop back into that range between the green line (lowest risk of the last seven earnings releases) and the red line (the highest risk of the last earnings releases).

But, there's actually something else that caught my eye.  Check out when GOOG hit the lows in risk (when the yellow circles are on the green line).  Since that time, we have sen the risk into earnings rise massively with each subsequent earnings report.

So, the real question is, why did that happen, and more importantly, why did that trend stop?

The option market's answer is simply:
The risk of large stock moves is lower for this earnings release than it has been for the prior seven and substantially lower than the last two.

Hmm...

The Skew Tab snap (below) illustrates the vols by strike by month.

Provided by Livevol

This is just a simple visual to demonstrate how earnings news affects risk.  The red curve represents the volatility in the July 11 weekly options (which do not have an earnings event), while the yellow curve represents the July 18th monthly options (which do have earnings).  That volatility difference between the two curves is the direct and explicit risk of a large stock move from earnings.

To read more about skew, what is and why it exists you can click the title below:
Understanding Option Skew -- What it is and Why it Exists.

Finally, the Options Tab is included below.

Provided by Livevol

Using the at-the-money (ATM) straddle in the July 18th monthly options we can see that the option market reflects a price range of [$547.50, $602.50].

  • If you believe the stock will be outside that range on expiry or any date before then, then you think the volatility is too low.
  • If you believe that range is too wide, and that the stock will definitively be in that range on expiration, then you think volatility is too high.
  • If you're not sure, and can make an argument for either case, then you think volatility is priced just about right.

This is trade analysis, not a recommendation.


Legal Stuff:
Options involve risk. Prior to buying or selling an option, an investor must receive a copy of Characteristics and Risks of Standardized Options. Investors need a broker to trade options, and must meet suitability requirements.

The information contained on this site is provided for general informational purposes, as a convenience to the readers. The materials are not a substitute for obtaining professional advice from a qualified person, firm or corporation. Consult the appropriate professional advisor for more complete and current information. I am not engaged in rendering any legal or professional services by placing these general informational materials on this website.

I specifically disclaim any liability, whether based in contract, tort, strict liability or otherwise, for any direct, indirect, incidental, consequential, or special damages arising out of or in any way connected with access to or use of the site, even if I have been advised of the possibility of such damages, including liability in connection with mistakes or omissions in, or delays in transmission of, information to or from the user, interruptions in telecommunications connections to the site or viruses.

I make no representations or warranties about the accuracy or completeness of the information contained on this website. Any links provided to other server sites are offered as a matter of convenience and in no way are meant to imply that I endorse, sponsor, promote or am affiliated with the owners of or participants in those sites, or endorse any information contained on those sites, unless expressly stated.

7-9-14: Daily Open Interest Report

Share on StockTwits

Daily Option Interest Report


Notable One-day Option Position Increases
GPRO+1076%
MRD+813%
ADHD+442%
Full List Below

Notable Large Option Position Increases Realtive to 3-month Average
CBSO+1608%
MRD+921%
ISLE+835%
Full List Below

Largest One-day Open Interest Increases


Largest Current Open Interest Relative to 90-day Average


This is trade analysis, not a recommendation.


Legal Stuff:
Options involve risk. Prior to buying or selling an option, an investor must receive a copy of Characteristics and Risks of Standardized Options. Investors need a broker to trade options, and must meet suitability requirements.

The information contained on this site is provided for general informational purposes, as a convenience to the readers. The materials are not a substitute for obtaining professional advice from a qualified person, firm or corporation. Consult the appropriate professional advisor for more complete and current information. I am not engaged in rendering any legal or professional services by placing these general informational materials on this website.

I specifically disclaim any liability, whether based in contract, tort, strict liability or otherwise, for any direct, indirect, incidental, consequential, or special damages arising out of or in any way connected with access to or use of the site, even if I have been advised of the possibility of such damages, including liability in connection with mistakes or omissions in, or delays in transmission of, information to or from the user, interruptions in telecommunications connections to the site or viruses.

I make no representations or warranties about the accuracy or completeness of the information contained on this website. Any links provided to other server sites are offered as a matter of convenience and in no way are meant to imply that I endorse, sponsor, promote or am affiliated with the owners of or participants in those sites, or endorse any information contained on those sites, unless expressly stated.

7-9-14: Daily Covered Calls Report

Share on StockTwits


Requirements
  • 1 million+ shares average daily volume
  • IV > 10%
  • IV < 60% 
  • Static Return (unassigned) > 5%

This information is available via optionsXpress Toolbox --> Idea Hub


This is trade analysis, not a recommendation.


Legal Stuff:
Options involve risk. Prior to buying or selling an option, an investor must receive a copy of Characteristics and Risks of Standardized Options. Investors need a broker to trade options, and must meet suitability requirements.

The information contained on this site is provided for general informational purposes, as a convenience to the readers. The materials are not a substitute for obtaining professional advice from a qualified person, firm or corporation. Consult the appropriate professional advisor for more complete and current information. I am not engaged in rendering any legal or professional services by placing these general informational materials on this website.

I specifically disclaim any liability, whether based in contract, tort, strict liability or otherwise, for any direct, indirect, incidental, consequential, or special damages arising out of or in any way connected with access to or use of the site, even if I have been advised of the possibility of such damages, including liability in connection with mistakes or omissions in, or delays in transmission of, information to or from the user, interruptions in telecommunications connections to the site or viruses.

I make no representations or warranties about the accuracy or completeness of the information contained on this website. Any links provided to other server sites are offered as a matter of convenience and in no way are meant to imply that I endorse, sponsor, promote or am affiliated with the owners of or participants in those sites, or endorse any information contained on those sites, unless expressly stated.

Tuesday, July 8, 2014

7-8-14: End of Day Report - Largest Stock Moves, New 52 Wk. Highs/Lows, Unusual Option Volume

Share on StockTwits

Earnings season begins today. Alcoa (AA) reported after the bell beating estimates and rising after hours.
---
In the second quarter, sales held steady year over year at $5.8 billion. Adjusted earnings landed at $0.18 per diluted share, up from $0.07 per share in the year-ago period.

Analysts would have settled for earnings around $0.12 per share on something like $5.7 billion in total revenue. Alcoa exceeded both of these estimates.

Source: Alcoa Inc. Crushes Q2 Earnings Targets; Shares Rise 1.5%
---


What to expect for the earnings season in general:
---
Profits of S&P 500 companies are expected to grow 6.2 percent in the second quarter, according to Thomson Reuters data, down from the 8.4 percent growth forecast at the start of April. Revenue is seen up 3 percent.

Source: Wall St. drops on earnings caution; Dow below 17,000
---

Remember those three numbers: 6.2% (new expectations) and 8.4% (old expectations) and 3% for revenue. This market has not been moving on fundamentals (some have argued), but I believe it will now. Those numbers are the fundamentals.


Top Headlines
* Concern over ‘severe’ pullback sends U.S. stocks sliding

* The 7 market myths that make investors poorer

* Today’s bubbles aren’t like those of the past

Top Option Story
* Apple (AAPL) - Earnings Preview & Resurrection: It's Time, Again, to Pay Attention to the Largest Company in the World

Open Interest
* Daily Open Interest Report

Covered Call
* Daily Covered Call Report

Biotech Index
* Daily Biotech Small & Micro Cap Update

Market Overview

Largest Stock Gainers


Largest Stock Losers


New 52 Wk Highs in S&P 500


New 52 Wk Lows in S&P 500
No New Lows


Unusual Option Volume


Elevated Implied Volatility (IV) to Historical Volatility (HV)


This is trade analysis, not a recommendation.


Legal Stuff:
Options involve risk. Prior to buying or selling an option, an investor must receive a copy of Characteristics and Risks of Standardized Options. Investors need a broker to trade options, and must meet suitability requirements.

The information contained on this site is provided for general informational purposes, as a convenience to the readers. The materials are not a substitute for obtaining professional advice from a qualified person, firm or corporation. Consult the appropriate professional advisor for more complete and current information. I am not engaged in rendering any legal or professional services by placing these general informational materials on this website.

I specifically disclaim any liability, whether based in contract, tort, strict liability or otherwise, for any direct, indirect, incidental, consequential, or special damages arising out of or in any way connected with access to or use of the site, even if I have been advised of the possibility of such damages, including liability in connection with mistakes or omissions in, or delays in transmission of, information to or from the user, interruptions in telecommunications connections to the site or viruses.

I make no representations or warranties about the accuracy or completeness of the information contained on this website. Any links provided to other server sites are offered as a matter of convenience and in no way are meant to imply that I endorse, sponsor, promote or am affiliated with the owners of or participants in those sites, or endorse any information contained on those sites, unless expressly stated.

7-8-14: Daily Biotech Small & Micro Cap Update

Share on StockTwits

The Ophir Gottlieb Small Cap Biotech Index
Is this the biotech revolution or the biotech bust?


Wanna talk momentum?  Sure the market has been down a bit, but small cap Biotechs are down 6% in two trading days. #MOMO lives and dies in Biotechnology.

Notable Stock Movers
TXMD+32.45%
CBPO+10.77%
AVXL+9.03%
IPCI-13.33%
ISCO-14.65%
AHRO-27.03%

Unusually Heavy Option Volume
TXMD:2315% of daily average
CBRX:2245% of daily average
HZNP:964% of daily average

231 small / micro cap biotech and pharma companies (equal weighted):
  • Public Biotech and Pharma Companies
  • Trade on North American Exchanges
  • Market Cap Range: [$0, $2 Billion]
  • Price, Employees, Revenue Range: Any


More on index construction and performance: The Ophir Gottlieb Small Cap Biotech Index

Today's Biotech Index Stock Movers


Today's Biotech Index Unusual Option Volume


Full Index Constituents and Moves


This is trade analysis, not a recommendation.


Legal Stuff:
Options involve risk. Prior to buying or selling an option, an investor must receive a copy of Characteristics and Risks of Standardized Options. Investors need a broker to trade options, and must meet suitability requirements.

The information contained on this site is provided for general informational purposes, as a convenience to the readers. The materials are not a substitute for obtaining professional advice from a qualified person, firm or corporation. Consult the appropriate professional advisor for more complete and current information. I am not engaged in rendering any legal or professional services by placing these general informational materials on this website.

I specifically disclaim any liability, whether based in contract, tort, strict liability or otherwise, for any direct, indirect, incidental, consequential, or special damages arising out of or in any way connected with access to or use of the site, even if I have been advised of the possibility of such damages, including liability in connection with mistakes or omissions in, or delays in transmission of, information to or from the user, interruptions in telecommunications connections to the site or viruses.

I make no representations or warranties about the accuracy or completeness of the information contained on this website. Any links provided to other server sites are offered as a matter of convenience and in no way are meant to imply that I endorse, sponsor, promote or am affiliated with the owners of or participants in those sites, or endorse any information contained on those sites, unless expressly stated.

* Apple (AAPL) - Earnings Preview & Resurrection: It's Time, Again, to Pay Attention to the Largest Company in the World

Share on StockTwits

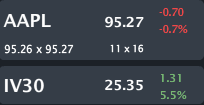
AAPL is trading $95.27, down small with IV30™ up 5.5%. The Symbol Summary is included below.

Provided by Livevol

I wrote a post on 5-27-2014 when AAPL was trading ~$89 (split adjusted).  This is a follow up to that post:
AAPL - Resurrection: When AAPL Innovates, It Changes the World. AAPL Has Found its Post Jobs Identity.

Conclusion
The forward looking risk in AAPL shares is low relative to historical measures and with earnings approaching, we must pay attention to the possibility of a risk malaise (risk under pricing).  AAPL is alive again, downside risk is here, and upside risk is just as real as downside.  It's time to stand up and pay attention to the largest company in the world.


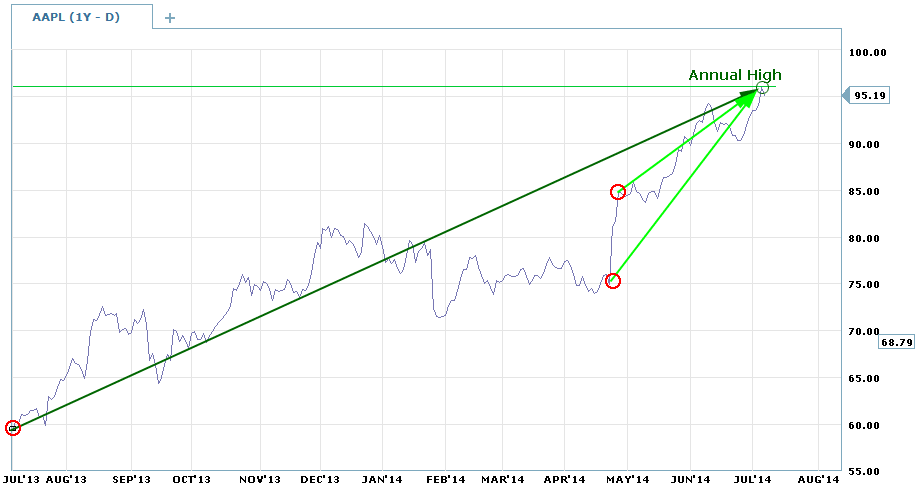
Yesterday (7-7-2014), AAPL hit an annual high and as of that time was up ~37% in the last year. Today is a small down day. The one-year stock chart is below.

Provided by Charles Schwab optionsXpress

Check out that move from the ~$75 level in late April as well as the move up since May (lots of arrows to look at).  Again, AAPL has now found its post Steve Jobs identity. Whether it's "good" or "bad" we are yet to see, but it's finally here.

---
In reality, Cook is taking Apple in new strategic directions, making it more difficult for competitors to follow. He is also focusing on areas that will boost profits – the key to Apple’s share price trends, both up and down – as much as revenue. And while new products may be important, Cook is pursuing just the sort of steady improvements that have historically been the key to Apple’s biggest gains.

Source: Yahoo! Finance, Poor, misunderstood Tim Cook is making all the right moves, written by Aaron Pressman
---

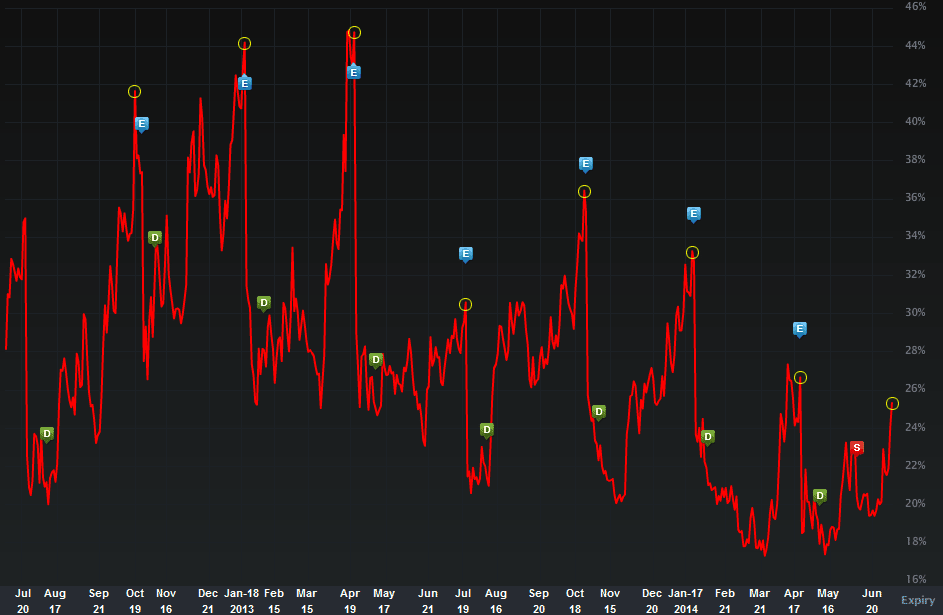
Let's turn to the risk. The IV30™ chart in isolation, below.

Provided by Livevol

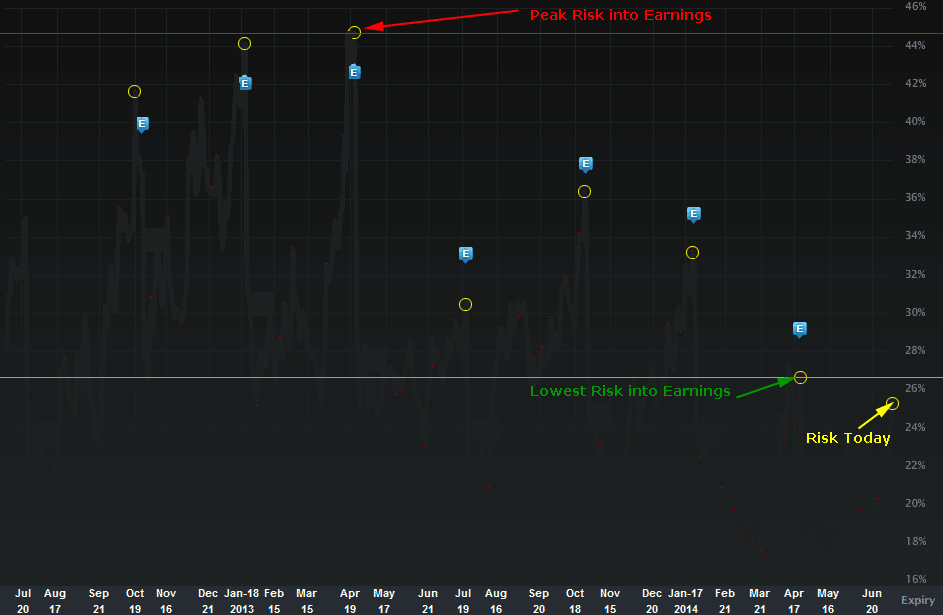
The implied volatility is the forward looking risk in the equity price as reflected by the option market (IV30™ looks forward exactly 30 calendar days).  Note the blue "E" icons represent earnings dates and I have circled them.  Actually, let's just focus on the earnings dates, the chart below does that:


Provided by Livevol

The peak 'risk' level into earnings was 45% on 4-12-2013.
The trough 'risk' level into earnings was 27% on 4-22-2014.

Note that the trough was the last earnings release and the stock moved hugely more than the option market priced.

The 'risk' level today is 25.5%, but that is going to rise into earnings on 7-21-2014. It is not appropriate to compare the 25.5% number to those other numbers quite yet. Don't get distracted by the divergence... soon, it will be real, but we must get closer to the event date

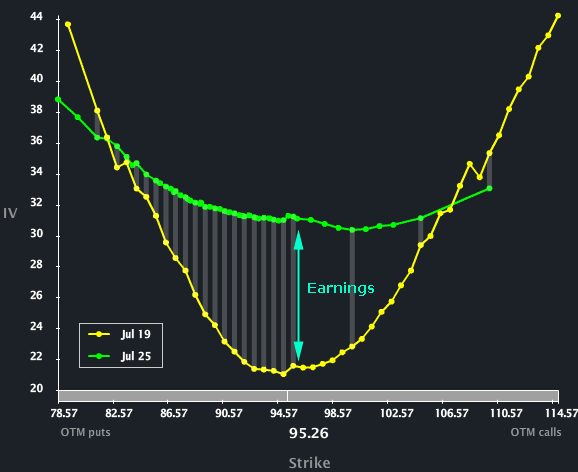
The Skew Tab snap (below) illustrates the vols by strike by month.

Provided by Livevol

To illustrate the risk of earnings visually compared to non-earnings options we can look at the Skew Tab.  The yellow curve are the July monthly options that expire on 7-18-2014.  The green curve are the Jul 25 weekly options.  Since earnings are due out on 7-21-2014, it's that green curve that holds the event and the divergence between the two (that blue arrow) reflects explicitly the risk of earnings.

For the record, the July 25 options are priced to 31.48%.  That will rise substantially.

To read more about skew, what is and why it exists you can click the title below:
Understanding Option Skew -- What it is and Why it Exists.

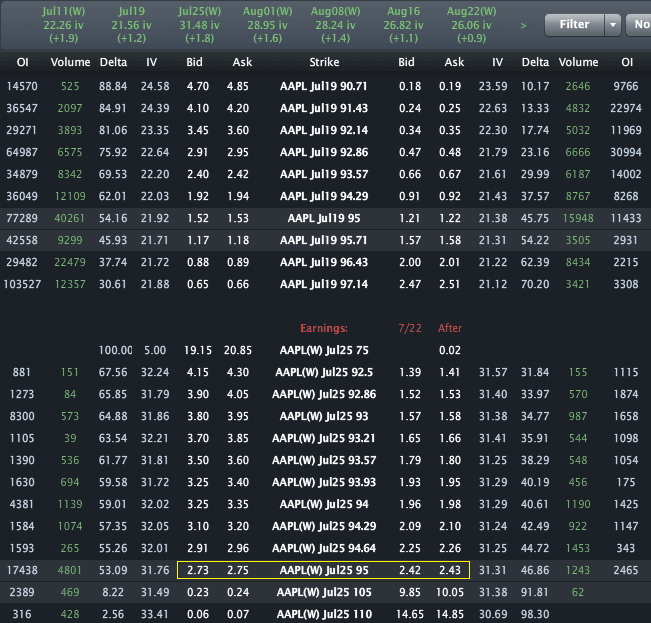
Finally, the Options Tab is included below.

Provided by Livevol

Using the at-the-money (ATM) straddle (in yellow) in the July 25 weekly options we can see that the option market reflects a price range of [$89.70, $100.30].

  • If you believe the stock will be outside that range on expiry or any date before then, then you think the volatility is too low.
  • If you believe that range is too wide, and that the stock will definitively be in that range on expiration, then you think volatility is too high.
  • If you're not sure, and can make an argument for either case, then you think volatility is priced just about right.

I think AAPL is going to be outside that range at some point either before or after earnings but before July 25th. Or, said differently, I think volatility is too low. Just a dude's opinion -- not a lot of conviction either way.

But please don't trade on my opinion, for what it's worth, I am not trading AAPL earnings.

This is trade analysis, not a recommendation.


Legal Stuff:
Options involve risk. Prior to buying or selling an option, an investor must receive a copy of Characteristics and Risks of Standardized Options. Investors need a broker to trade options, and must meet suitability requirements.

The information contained on this site is provided for general informational purposes, as a convenience to the readers. The materials are not a substitute for obtaining professional advice from a qualified person, firm or corporation. Consult the appropriate professional advisor for more complete and current information. I am not engaged in rendering any legal or professional services by placing these general informational materials on this website.

I specifically disclaim any liability, whether based in contract, tort, strict liability or otherwise, for any direct, indirect, incidental, consequential, or special damages arising out of or in any way connected with access to or use of the site, even if I have been advised of the possibility of such damages, including liability in connection with mistakes or omissions in, or delays in transmission of, information to or from the user, interruptions in telecommunications connections to the site or viruses.

I make no representations or warranties about the accuracy or completeness of the information contained on this website. Any links provided to other server sites are offered as a matter of convenience and in no way are meant to imply that I endorse, sponsor, promote or am affiliated with the owners of or participants in those sites, or endorse any information contained on those sites, unless expressly stated.