Tuesday, September 21, 2010

Teradyne (TER) - Puts Trade on Stock Pattern

TER is trading $10.46, with IV30™ up 0.5%. The LIVEVOL™ Pro Summary is below.


The company has traded over 7,000 options on total daily average option volume of just 2,160. All but 247 contracts have been puts yielding a 28:1 put:call ratio. The most action was in the Nov 10 puts were over 4,500 contracts traded and in the Oct 11 puts were 2,000 traded. The Stats Tab and Day's biggest trades snapshots are included (click either image to enlarge).


The Options Tab (click to enlarge) illustrates that the Nov puts are entirely opening (compare OI to trade size). This is long interest. You can also see that Nov vol is the highest in the entire chain as it has an earnings cycle. I can't tell what the Oct trading was, but based on the skew tab, I am leaning toward sales.


The Skew Tab snap (click to enlarge) illustrates the vols by strike by month.


This is a pretty cool skew chart. We can see the Oct options that traded (highlighted) are the lowest vol in the entire options chain for the first three months. We can also the Nov 11 line (highlighted) and how that vol is substantially above Oct. This feels like buying Nov and selling Oct. As of this writing, that would be selling 42.5 vol and buying 53.

Finally, the Charts Tab (6 months) is below (click to enlarge). The top portion is the stock price, the bottom is the vol (IV30™ - red vs HV20™ - blue vs HV180™ - pink). The yellow shaded area at the very bottom is the IV30™ vs. the HV20™ vol difference.


The IV30™ looks pretty fair. The one thing that jumps out at me on this chart is the stock pattern. It has a tendency to peak and crash then repeat with lower peaks and lower troughs. For what it's worth, it's at another possible peak right now.

This is trade analysis, not a recommendation.

Legal Stuff:
http://www.livevolpro.com/help/disclaimer_legal.html

Infinera (INFN) - Call Buying, Skew Discovery Provides Possible Trade

INFN is trading $11.70, down 2.3% with IV30™ up 11.6%. The LIVEVOL™ Pro Summary is below.


INFN is a provider of optical networking systems based on Photonic Integration technology.

The company has traded over 9,700 options on total daily average option volume of just 1,248. All but 254 contracts have been calls yielding a 37:1 call:put ratio. The action has been in the Oct 12.5 calls were over 6,200 contracts have traded with substantially buying interest. The Stats Tab and Day's biggest trades snapshots are included (click either image to enlarge).


The Options Tab (click to enlarge) illustrates that the calls are mostly opening (compare OI to trade size). You can also see at the top that Oct vol is up a full 8 points, or 16% while Nov is up just 1.1 points and Jan'11 is up just 0.8 vol points.


The Skew Tab snap (click to enlarge) illustrates the vols by strike by month.


The buying interest in Oct has pushed the entire month above Nov and has created a noticeable kink upward in the OTM calls. Though the 12.5 calls are a bit higher than "normal," it's really the 14 and 15 calls that exhibit a pronounced vol push.

Finally, the Charts Tab (6 months) is below (click to enlarge). The top portion is the stock price, the bottom is the vol (IV30™ - red vs HV20™ - blue vs HV180™ - pink). The yellow shaded area at the very bottom is the IV30™ vs. the HV20™ vol difference.


We can see a few things right off the bat:
1) The stock is in the midst of a pop. Going from $8.28 a few weeks ago to nearly $12 yesterday.
2) The stock gapped up on earnings in late July going from $6.99 to $9.14 (31%) in one day.
3) The IV30™ has just now risen to the longer term realized (HV180™ is 58).

Possible Trades to Analyze
Oct 12.5/14 call spread: Buying the calls that are getting piled on and selling the elevated skew. Total debit of $0.30 if possible. A Nov 12/Oct 14 call spread pays ~$0.85 and buys the cheaper Nov vol (53) and sells the elevated Oct skew (63) while potentially getting earnings in Nov.

This is trade analysis, not a recommendation.

Legal Stuff:
http://www.livevolpro.com/help/disclaimer_legal.html

Compellant Technologies (CML) - Time Spread Opportunity

CML is trading $18.02. The LIVEVOL™ Pro Summary is below.


I found this company using a custom real-time scan I developed on Livevol Pro. The details are included below:

Time Spread Scan Details
Stock Price >= $5
Avg. Option Volume >= 1500
Industry != Bio-Tech
Sigma1 - Sigma2 >= 7
Sigma1 >= 1
Sigma2 >= 1
Days After Earnings <= 10 >= 70

Lets take a look at the Skew Tab first (click to enlarge). In this case, I'm interested less in the shape of the skew than a simple graphical representation of the vol diffs ATM.


I've highlighted the month to month vol difference. The company had earnings 7-28-2010 AMC, so a reasonable projection is that the next earnings release will be after Oct expo which is 10-15-2010. That means a time spread not only buys low vol against selling high vol, but it also gets the benefit of buying a vol event (earnings).

Let's finally look to the Options Tab for prices (click to enlarge).


It looks like with some reasonable liquidity an Oct 17.5 straddle could be sold @ $3.05 while the Nov 17.5 straddle could be purchased for $4.60, or a total of a $1.55 debit. Keep in mind, time spreading by purchasing the back is long vega. That means a takeover will likely be a large loser. The ideal situation here is that CML pins on the strike at Oct expo, yielding a cheap long straddle in Nov with an earnings event. The worst case scenario is a large move away from the strike pre Oct expo. A rise in vol without a stock move is also a winner.

A few other things to note.
IV30™: 84.22
HV20™: 100.80
HV180™: 76

So this stock moves pretty big and both the 86 vol sale (Oct) and 79 vol purchase (Nov) are substantially less than the recent short term realized vol. A Nov ATM straddle purchase in and of itself looks somewhat reasonable.

This is trade analysis, not a recommendation.

Legal Stuff:
http://www.livevolpro.com/help/disclaimer_legal.html

Monday, September 20, 2010

SunPower (SPWRA) - Low Vol and Uneven Skew May be Purchase

SPWRA is trading $12.39, up 3.0% with IV30™ up 3.0% as well. The LIVEVOL™ Pro Summary is below.


SPWRA is a vertically integrated solar products and services company that designs, manufactures and markets high-performance solar electric power technologies.

I found this stock from my low vol real-time custom scan. You can read about the details of the scan here: Custom Scan: Finding Low Vol to Purchase

The company has traded over 11,000 options on total daily average option volume of just 4,259. All but 251 contracts have been calls yielding a 46:1 call:put ratio. The action has been in the Oct 14 and 15 calls; mostly long interest I believe. The Stats Tab and Day's biggest trades snapshots are included (click either image to enlarge).


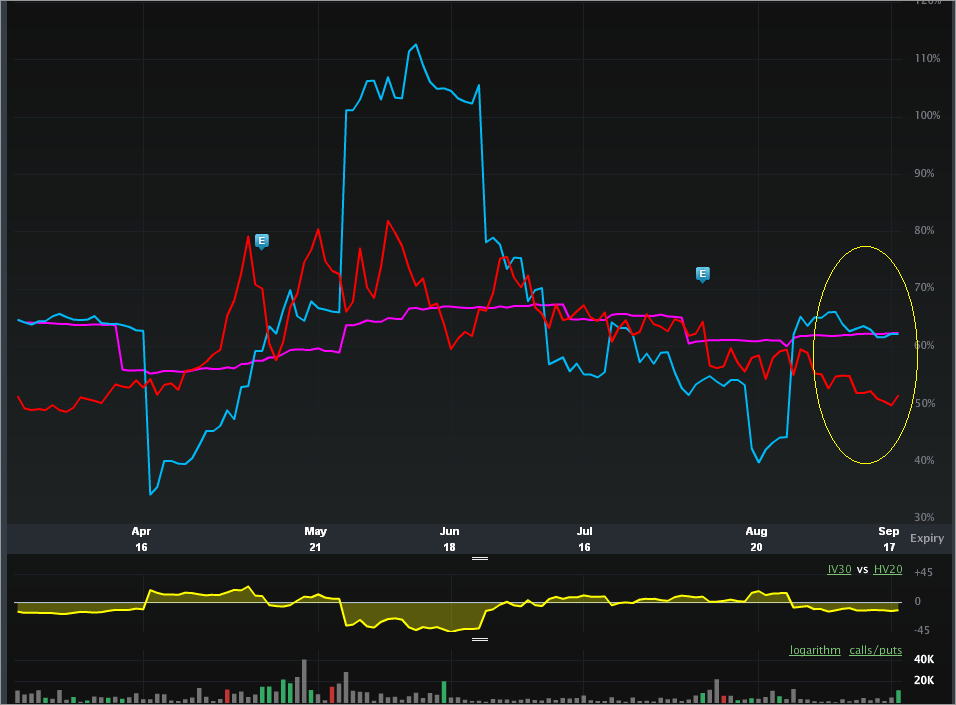
Let's look to the Charts Tab before looking at prices. The 6 month vol chart (IV30™ - red vs HV20™ - blue vs HV180™ - pink) is included (click to enlarge). The yellow shaded area at the very bottom is the IV30™ vs. the HV20™ vol difference.


We can see the IV30™ is 51 while HV20™ and HV180™ are 62. In other words, the short term and long term realized volatility in the stock has been more than 10 points higher than the current implied. This stock was recently upgraded by two sell side firms giving it a nice little pop at the end of August and shooting the HV20™ up (see blue line pop).

The Skew Tab snap (click to enlarge) illustrates the vols by strike by month.


What's cool here is that not only is the IV30™ low relative to short and long term realized, but the $13 strike is oddly low, pricing a little less than 47 vol. The 14, 15 strikes are then higher because of the order flow.

Finally, let's look to the Options Tab (click to enlarge).


First, we can see that the calls today are opening (volume >> OI). Next we can see some prices.

Possible Trades to Analyze
To really jump on a "guess" of low vol, a 13 strike straddle can be purchased for ~$1.37. That would require SPWRA to be outside of the range ($11.63, $14.37) if held to Oct expo in order to be profitable. Selling the Oct 11,14 strangle @ $0.35 brings the net debit down to $1.02. A 12/14 strangle sale brings the debit down to $0.77.

A more bullish approach could be to buy the Oct 13 calls and sell the Oct 12 puts @ a net credit of ~$0.11. A touch less risky is selling the Oct 11 puts instead, creating a net debit of just ~$0.18.

This is trade analysis, not a recommendation.

Legal Stuff:
http://www.livevolpro.com/help/disclaimer_legal.html

Chelsea Therapeutics (CHTP) - News is Out, Friday was a Trading Opportunity

CHTP is trading $6.40, up 26.5% with IV30™ down 193 vol points or 67%. The LIVEVOL™ Pro Summary is below.


On Friday right near the close I wrote this:
Chelsea Therapeutics (CHTP) - Bio-tech Stock Pops.

I noted a wild pop in CHTP out of nowhere. The Tick Chart from that day is included below:


Today we finally get the follow through on the news. The Phase III results were positive, vol is gone, stock is ripping (though well of the day highs. The Key Developments snap from Livevol Pro (from Reuters) is included below:


Hopefully some of you made some money on this. I didn't.


This is trade analysis, not a recommendation.

Legal Stuff:
http://www.livevolpro.com/help/disclaimer_legal.html

Delta Airlines (DAL) - Airlines Showing Long Interest; Bullish Market Sentiment

DAL closed at $11.18 on Friday, down 3.4%. The LIVEVOL™ Pro Summary is below.


On 8-20-2010 I wrote this: Delta Air Lines (DAL) - Liquidity in Jan '11 with Spiked Vol

I noted these trades (best I could tell):
Buy Jan '11 12 and 14.5 calls
Buy Jan'11 10 puts
Sell Jan '11 9 puts

Friday saw more bullish action, with IV30™ down 7 points (13%) and stock up 4% since the 8-20 blog.

The company traded over 29,000 options on total daily average option volume of just 8,261. All but 2,437 contracts were calls yielding an 11:1 call:put ratio. The largest trade was over 8,000 Mar'11 15 call purchases. The Stats Tab and Day's biggest trades snapshots are included (click either image to enlarge).


The Options Tab (click to enlarge) illustrates that the calls are opening (compare OI to trade size).


The Skew Tab snap (click to enlarge) illustrates the vols by strike by month.


The skew looks nice and normal, no upside reaction as of yet to the long interest in the calls.

Finally, the Charts Tab (6 months) is below (click to enlarge). The top portion is the stock price, the bottom is the vol (IV30™ - red vs HV20™ - blue vs HV180™ - pink). The yellow shaded area at the very bottom is the IV30™ vs. the HV20™ vol difference.


We can see short term implied is above the short term realized, but right in line with the longer term realized. Today the IV30™ is actually up 4% in early morning trading to nearly 50. HV180™ is 48.

Long interest in the Airlines in my mind is a sort of confirmation that the market feels bullish. This order flow in combination with the flow from the prior blog (above) is a confirmation of that sentiment.

This is trade analysis, not a recommendation.

Legal Stuff:
http://www.livevolpro.com/help/disclaimer_legal.html

Friday, September 17, 2010

Chelsea Therapeutics (CHTP) - Bio-tech Stock Pops

CHTP is trading $5.53, up 34.2% in the last minute with IV30™ up 5.0%. The LIVEVOL™ Pro Summary is below.


On 8-23-2010 I wrote this article: Chelsea Therapeutics (CHTP) - Trading a Bio-tech With News

The stock has taken off in the last few minutes, the Livevol Pro Tick Chart is included (click to enlarge).


The company has traded over 20,000 options on total daily average option volume of just 950. Calls have traded on a 5:1 ratio. The Stats Tab and Day's biggest trades snapshots are included (click either image to enlarge).


Apparently some good news leaked or is going to leak, or... Either way, I just wanted to get this one out before the weekend. The details are in the first blog (above), no need for me to repeat them.

This is trade analysis, not a recommendation.

Legal Stuff:
http://www.livevolpro.com/help/disclaimer_legal.html

Louisiana-Pacific (LPX) - Call Buyers and Skew Bends

LPX is trading $7.50. The LIVEVOL™ Pro Summary is below.


The company traded over 16,000 options on total daily average option volume of just 2,772. All but 113 contracts have been calls. The action has been in the Nov 20 calls where over 15,000 have traded. The Stats Tab and Day's biggest trades snapshots are included (click either image to enlarge).


The Options Tab (click to enlarge) illustrates that the calls are opening (compare OI to trade size). You can also see that Oct vol is below Nov, Jan'11, Feb'11 and even Jan'12.


The Skew Tab snap (click to enlarge) illustrates the vols by strike by month.


As expected, the order flow has pushed the vol in Nov up on the call side. A reverse skew has formed in Nov, making those calls less attractive as a purchase.

Finally, the Charts Tab (6 months) is below (click to enlarge). The top portion is the stock price, the bottom is the vol (IV30™ - red vs HV20™ - blue vs HV180™ - pink). The yellow shaded area at the very bottom is the IV30™ vs. the HV20™ vol difference.


Two things I note. First, the IV30™ lies in between the HV20™ and HV180™ making it sort of a coin flip as to a purchase or a sale. Second, note that LPX was as high as $13.44 in April, making the 9 level call feel very "in the money-able" for lack of a better term.

This is trade analysis, not a recommendation.

Legal Stuff:
http://www.livevolpro.com/help/disclaimer_legal.html

NetLogic (NETL) - Custom Scan and Finding Low Vol to Purchase

NETL is trading $25.54, down 0.5% with IV30™ down 4.6%. The LIVEVOL™ Pro Summary is below.


-----------------------------------------------------------


Click for Free Trial

-----------------------------------------------------------

This is one of a series on custom scans and identifying trading opportunities. You can read either of the other two here:

Time Spread Custom Scan
Elevated Vol Custom Scan

With the market going up and the VIX going down, I am starting to look for opportunities to buy options (gasp!). I created a third custom scan, this one looking for back spread (purchase) opportunities. A snapshot of the custom scan is included.


Custom Scan Details
Stock Price GTE $10
IV30™ GT 1
Industry isNot Bio-tech
Average Option Volume GTE 1000
IV30™ - HV20™ LTE -10 GTE -75
Days After Earnings GTE 29

So, non-bio tech stocks that are more than $10, with HV20™ at least 10 points higher than IV30™ which are not affected by earnings.

I found NETL. We will look at four charts to analyze the vol situation. First, let's look at the broader view. A one year vol chart of IV30™ (red), HV20™ (blue) and HV180™ (pink). Click the image to enlarge.


We can see that the red line is below both the blue line and the pink line. In English, the Oct options are trading lower than the stock has moved over the last 20 trading days and the longer measure of the last 180 trading days.

Specifics
IV30™: 37.98
HV20™: 48.17
HV180™: 50

Let's now look at each vol by itself. First, the HV180™ over the last year.


A very cool chart, we can see long term trends in HV180™ for NETL. It collapsed from Sep09 to Jan10 where it fell to 37, then went straight up to its current level of 50.

Next, we'll look at the one year chart of HV20™.


We can see a strong cyclical move in the short term realized vol around earnings. This might actually be a good stock to buy earnings vol in given that abrupt pattern. While it peaked from last earnings, it has fallen to a more steady state of 48.

Finally, the one year chart for the IV30™.


The IV30™ also has a cyclical pattern with earnings, which is to be expected - rise into earnings, collapse out of earnings. More interesting however is that the IV30™ today has dipped below it's longer term support. I have drawn in a yellow line to clearly illustrate this "breach."

In all, we see a low IV30™, falling below a support level today, with the short term and long term realized well above it. We note that HV180™ started dropping pretty significantly right around now, last year.

Finally, let's look to the Options Tab.


Possible Trades to Analyze
A purchase of the 25 straddle, 26 straddle or 25/26 strangle is all around 38 vol. Looking to the 26 straddle, a $2.25 purchase requires NETL to be outside of the range [$23.75, $28.25] by Oct expo. Alternatively, a vol increase before then also makes this trade a winner. The 52 wk range for NETL is [$18.43, $35.00].

This is trade analysis, not a recommendation.

Legal Stuff:
http://www.livevolpro.com/help/disclaimer_legal.html

Hong Kong Index (EWH) - A Bet on Calm Broader Markets

EWH (MSCI Hong Kong Index) closed at $17.21 yesterday, basically unched for the day. The LIVEVOL™ Pro Summary is below.


The ETF traded over 11,300 options on total daily average option volume of just 2,771. All but 73 contracts were puts. The largest trade was a sale of 11,000 Oct 17 puts @ $0.225. The Stats Tab and Day's biggest trades snapshots are included (click either image to enlarge).


The Options Tab (click to enlarge) illustrates that the puts are opening (compare OI to trade size). You can also see that Oct vol is just 17, relative to Dec (20) and Jan'11 (21). This back month pattern where vols increase moving out is similar to what I posted yesterday: IVZ - Playing Vol Backwardation and Long Vega.


Finally, the Charts Tab (6 months) is below (click to enlarge). The top portion is the stock price, the bottom is the vol (IV30™ - red vs HV20™ - blue vs HV180™ - pink). The yellow shaded area at the very bottom is the IV30™ vs. the HV20™ vol difference.


Note a few interesting things:
1) IV30™ (17.4) is above well HV20™ (11.3).
2) HV180™ (19) is above both IV30™ and HV20™.

So the long term realized vol is above the implied and well above the near term realized vol. The sale yesterday is a bet that the realized vol stays low (below the 17 vol sale). This is a pretty big bet in a broad market indicator. Basically, it's a bet that China (Hong Kong) is not going to see any big vol events in the often times vol driven month of October.

This is trade analysis, not a recommendation.

Legal Stuff:
http://www.livevolpro.com/help/disclaimer_legal.html