Thursday, September 16, 2010

Invesco (IVZ) - Playing Vol Backwardation and Long Vega

IVZ is trading $20.91, up small with IV30™ down 0.3%. The LIVEVOL™ Pro Summary is below.


The company has traded over 8,200 options on total daily average option volume of just 418. All but 234 contracts went up in a single put spread; buying Jan'11 20 puts and selling Oct 20 puts paying $1.10 net. The Stats Tab and Day's biggest trades snapshots are included (click either image to enlarge).


The Options Tab (click to enlarge) illustrates that the puts are at least partially opening (compare OI to trade size). You can also see that OctIV < Jan'11IV < Apr'11IV.


The Skew Tab snap (click to enlarge) illustrates the vols by strike by month.


This more clearly demonstrates the month to month vol diffs with the back getting more expensive than the front.

Finally, the Charts Tab (6 months) is below (click to enlarge). The top portion is the stock price, the bottom is the vol (IV30™ - red vs IV90™ - green vs HV90™ - blue vs HV180™ - pink). The yellow shaded area at the very bottom is the IV30™ vs. the HV20™ vol difference.


I've highlighted the vols. This chart makes the bet a little more clear. The long term historical vol is 43. The 90 day historical is 45. Both of the IV's traded are below the historicals. IV30™ (sold) is 37 and IV90™ (bought) is 39.

This is an interesting trade as it gets long vega which is slightly depressed. If IVZ hangs around $20 by Oct expo, this trade could turn out very well. Further, if the vol elevates in the same pattern - that is, the back goes up more than the front, this bet also wins nicely. If backwardation eases up, this trade can lose pretty fast.

This is trade analysis, not a recommendation.

Legal Stuff:
http://www.livevolpro.com/help/disclaimer_legal.html

Hologic (HOLX) - Elevated Vol Custom Scan Trade

HOLX is trading $16.53, up 1.2% with IV30™ down 2.3%. The LIVEVOL™ Pro Summary is below.


Back by popular demand, I found this stock using another real-time custom scan. This one hunts for high vols. Click to read the Time Spread Custom Scan. The custom details pic for this vol scan is included (click to enlarge).


Custom Scan Details
Stock Price >=5
IV30™ - HV20™ >= 10
HV180™ - IV30™ <= -8
Average Option Volume >= 1,200
Industry != Bio-tech
Days After Earnings >= 10 <= 60

The goal with this scan is to identify short-term implied vol (IV30™) that is elevated both to the recent stock movement (HV20™) and the long term trend in stock movement (HV180™). I'm also looking for a reasonable amount of liquidity in the options (thus the minimum average option volume), want to avoid bio-techs (and their crazy vol) and make sure I'm not selling elevated IV30™ simply because earnings are approaching.

The HOLX Charts Tab is included (click to enlarge). The top portion is the stock price, the bottom is the vol (IV30™ - red vs HV20™ - blue vs HV180™ - pink). The yellow shaded area at the very bottom is the IV30™ vs. the HV20™ vol difference.

We can see IV30™ is ~54 vs HV20™ of 34. Also, the long term trend of realized vol, HV180™, is just 37, so vol is elevated. You can actually find a bunch of stocks with short term implied that's elevated relative to short term realized as the market has been in a steady upswing and we're going into Oct, which can be "jittery" to say the least. I like HOLX in particular because the long term HV is also quite low.

The Skew Tab snap (click to enlarge) illustrates the vols by strike by month.


We can see here that the skew is normal, rather pretty really. So this is a vol play on the ATM, not so much a scalp on skew. Finally, let's look to the Options Tab.


We can see that the Oct 16 straddle is priced at about 53.5 vol, while Oct 17 straddle is more like 52.5 vol.

Possible Trades to Analyze
The riskiest trade would be a naked straddle sale. In this new found world of takeovers, I think a touch more prudence may be appropriate. An Oct 16 straddle sale @ $2.10 with either an Oct 17 or Oct 18 call purchase protects the upside. By selling the Oct 16 straddle rather than the 17, the trade sells higher vol, but more importantly, this trade also gives ~$0.50 more room to a naked downside.

The Oct 16 straddle sale with the 17 call purchase nets a $1.30 credit, so the trade wins to the upside at all prices. It does however leave a naked downside and loses below $14.70 at expo. HOLX 52 wk range is [$13.22, $19.72].

This is trade analysis, not a recommendation.

Legal Stuff:
http://www.livevolpro.com/help/disclaimer_legal.html

Wednesday, September 15, 2010

BJ's Wholesale (BJ) - Time Spreading on Vol Differences and Custom Scans

BJ is trading $42.32. The LIVEVOL™ Pro Summary is below.


-----------------------------------------------------------


Click for Free Trial

-----------------------------------------------------------

I found this stock using a custom scan I built in Livevol Pro. I've included a snapshot.


Time Spread Scan Details
Stock Price >= $5
Avg. Option Volume >= 1500
Industry != Bio-Tech
Sigma2 - Sigma3 >= 7
Sigma2 >= 1
Sigma3 >= 1
Days After Earnings <= 10 >= 70

The Sigma2/3 >=1 is just a sanity check so I don't get any weird bond funds with 0.5 vol or whatever. The days after earnings makes it so I can eliminate some earnings vols from the front month, as I am looking for natural time spreads, not earnings plays (I have a separate scan for earnings).

I have included the Skew Tab (click to enlarge). This illustrates pretty clearly the vol diff from Oct to Dec. I've highlighted the 40/45 strangle.


Moving to the Options Tab I can see the actual prices and possible trade.


Possible Trade to Analyze
Sell the Oct 40/45 strangle @ $1.70
Buy the Dec 40/45 strangle for $3.35
Net debit is $1.65.

The Oct strangle sells 39 vol (ish) and the Dec strangle purchases 32 vol (ish). The trick here is that earnings look like they will occur after Oct 15th (expo). I see projections from Oct 18th out to Nov 17th. If this is true, this trade buys low vol with an earnings date and sells high vol without. Could be a neat trick.

This trade loses to large moves away from the long strikes in Oct, or an absolute vol disintegration as it is long vega. So a takeover would be bad. It wins to time decay and vol increases with the stock sitting.

This is trade analysis, not a recommendation.

Legal Stuff:
http://www.livevolpro.com/help/disclaimer_legal.html

Harely-Davidson (HOG) - Low Vol Pattern and Heavy Volume Presents Opportunity

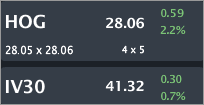
HOG is trading $28.06, up 2.2% with IV30™ up 0.7%. The LIVEVOL™ Pro Summary is below.


The company has traded over 20,000 options in the first two hours on total daily average option volume of just 6,089. Calls have traded on a nearly 10:1 ratio to puts, with the Sep 28, Oct 29-31 calls being the most active. The Stats Tab and Day's biggest trades snapshots are included (click either image to enlarge).


The Options Tab (click to enlarge) illustrates that all the calls are mostly opening (compare OI to trade size). The best I can tell, Oct 29, 30 are long interest, Oct 31 is short, and Sep 28 is ambiguous to me.


Note that the Oct calls all traded ~40 vol (or a bit below).

The Skew Tab snap (click to enlarge) illustrates the vols by strike by month.


We can see the upside in Sep with just a couple days to go to expo is pretty bid. The Sep 29 calls are quoting 50 vol and the Sep 30's are quoting 70 vol, though that's just a $0.03 bid, so no real "information" there in my opinion.

We can also see that the upside in Oct (highlighted in the skew chart) looks pretty normal, with just a hint of a curve back up near the tail.

Finally, the Charts Tab (6 months) is below (click to enlarge). The top portion is the stock price, the bottom is the vol (IV30™ - red vs HV20™ - blue vs HV180™ - pink). The yellow shaded area at the very bottom is the IV30™ vs. the HV20™ vol difference.


The stock has been range bound of late, though it is a pretty wide range of ~$22 to ~$28. We can see the stock gapped up on earnings pushing the short term realized above the implied. Long term realized vol is 45, so the Oct trades are fairly discounted to that. HV90™ (51) is even higher than HV180™ making the Oct trades feel even cheaper.

Possible Trades
For a bullish bet on low vol, an Oct 25/31 risk reversal (sell puts/buy calls) can go up for a small credit while selling 46 vol and purchasing 40. The Oct 28 straddle is worth about $2.60, which if the trend continues would be less than the stock could move by Oct expo.

This is trade analysis, not a recommendation.

Legal Stuff:
http://www.livevolpro.com/help/disclaimer_legal.html

Tuesday, September 14, 2010

Radware (RDWR) - Stock Explodes Mid-day on Rumors; Someone Knew...

RDWR is trading $38.24, up 37.2% with IV30™ up 76.2%. The LIVEVOL™ Pro Summary is below.


At around 1:05pm EST, the stock ripped up on apparently no news. The Tick Chart is included (click to enlarge). Note how the front month vol exploded, and the back months were more muted.


The company has traded over 12,000 options on total daily average option volume of just 653. Calls are trading on a 5:1 ratio to puts. The Stats Tab and Day's biggest trades snapshots are included (click either image to enlarge).


The Options Tab (click to enlarge) illustrates that the Sep 35 calls have the bulk of the volume on 0 (zero) OI. These were all opening today.


Note the vols. Sep is up to 215 (up 160 points), Oct is up to 86 (up 37 points) while Dec is 56, up only 8.8 points.

I can't find any real news on this thing, but it's obviously a takeover rumor/news story. The market in general has found itself in a takeover heavy wave which is usually the beginning of a strong bull market. Of course, a few weeks does not a trend make.

Possible Trades to Analyze
I don't really like trading this kind of news.. ok, that's a lie... I don't like telling people to trade this kind of news. I will say this, a buy write (buy stock/sell call) in the Sep 30 line would look like this:

Buy 100 Shares RDWR for $38.24
Sell 1 Sep 30 calls @ $8.60
That's just $0.36 over parity.

But...
Selling 1 RDWR Sep 30 put @ $0.45 is the same thing (except you don't own stock, which has value in a rights/voting/tender event), but $0.09 better. So owning stock (regardless of deltas) seems to have value. Ok, that's all I'm saying. We have some positions, but not that trade.

In terms of fishyness... Yes...

Below are the trades in the Sep 25 calls. Note the first few are before the spike. Some one was paying $3.40 and $3.70 on $0.45 and $0.30 wide markets 400x in a stock that trades just 400 calls a day. All that was done in 11 minutes.


Also interesting, looking at just trades that are 10 lots or larger, from 9:42am to 11:56am, there were zero trades. Then, all of a sudden, an hour before "the move," the call buying came in. Those trades are included (click to enlarge). This accounted for over 500 call purchases.


This is trade analysis, not a recommendation.

Legal Stuff:
http://www.livevolpro.com/help/disclaimer_legal.html

* UPDATE: Arena (ARNA) - Bio-tech Review

* UPDATE

ARNA is trading $4.40, down 35.8% with IV30™ up 7.5%. The LIVEVOL™ Pro Summary is below.


On Thursday, July 29, 2010 I wrote:
Arena Pharma (ARNA) - Big Bio-tech Vol Yields Trade

ARNA was trading $6.45. The Livevol Pro summary from that date is included below.


If you recall, we looked at a crazy 6 way spread which peaked PnL with the stock at $4 or $8 (ish) on Sep expo. The PnL chart is included (click to enlarge).


Note that the dip on the upside PnL was between $5 and $7. This was done on purpose. It would reflect a belief that ARNA will be moving away from its then current price ($6.50). With the stock movement today, this trade from Frank Fahey actually worked out pretty well.

This is trade analysis, not a recommendation.

Legal Stuff:
http://www.livevolpro.com/help/disclaimer_legal.html

Lazard (LAZ) - Call Buying on Realized Vol Scalp

LAZ closed $34.22 yesterday, up 4.7%. The LIVEVOL™ Pro Summary is below.


The company traded over 9,000 options on total daily average option volume of just 858. All but 577 contracts were calls yielding a 16:1 call:put ratio. The action was in the Oct 35, 38 and Dec 40 calls. The Stats Tab and Day's biggest trades snapshots are included (click either image to enlarge).


The Options Tab (click to enlarge) illustrates that the calls are all mostly opening (compare OI to trade size). The large volume (Oct 38 and Dec 40) were purchases and in one order. I can't quite tell about the Oct 35 calls.


The Skew Tab snap (click to enlarge) illustrates the vols by strike by month.


We can see a rather rickety skew, my guess is it evens out slowly, but the vol differences don't seem large enough to present a real trading opportunity based solely on skew unless the kinks get larger. Definitely worth watching though.

Finally, the Charts Tab (6 months) is below (click to enlarge). The top portion is the stock price, the bottom is the vol (IV30™ - red vs HV20™ - blue vs HV180™ - pink).


We can see the short term implied and the long term historical are actually right on top of each other, it's the short term historical that is elevated. Owning the short term options would have been a winner. The stock has been on a steady rise since mid June and the order flow seems to bet on more of the same; that is, more vol in stock than the options imply and generally and upward move.

This is trade analysis, not a recommendation.

Legal Stuff:
http://www.livevolpro.com/help/disclaimer_legal.html

Monday, September 13, 2010

Best Buy (BBY) - Earnings Preview and Trades

* UPDATE: Disclosure - I sold a Sep strangle and bought a Sep strangle further OTM.

BBY is trading $34.46, up 1.7% with IV30™ up 4.6%. The LIVEVOL™ Pro Summary is below.


BBY has earnings out tomorrow before the bell.

For the last eight quarters a sale of the BBY ATM straddle the day before earnings and a purchase the day after has been a winner eight times in a row, with a minimum gain of 32.5% and a max gain of 70.7%. The stats I derived from Livevol Excel are included (click to enlarge).


The front month vol is 78, the back month is 42. I have included the Skew Tab (click to enlarge).


Note how much higher the red curve is to the other months. This is not a mistake of course, with just 4 days to go to expo, the earnings event creates a weighted average of vols that is substantially earnings (1/4 days). The vol should be much higher in Sep as it is.

I see the Sep 34 straddle priced at $2.30. The The Options Tab (click to enlarge) is included below.


Trade to Analyze
Sell 1 Sep 34 straddle @ $2.30
Let's see what happens on close tomorrow.

A few things to keep in mind.
1) Market feels bullish lately.
2) I believe this is a huge earnings release for BBY as they project the holiday season.

Some alternatives to naked straddle selling are:
1) Sell the Sep straddle, Buy the Oct straddle (though this is long vega)
2) Sell the Sep straddle buy the 31/37 strangle. This yields a $1.80 credit with protection to both sides.
3) Sell a 34/35 strangle, buy a 33/36 strangle (or something like that).
4) Forget all this analysis, maybe you want to make a bet on direction and buy a call spread or put spread.

This is trade analysis, not a recommendation.

* UPDATE: Disclosure - I sold a Sep strangle and bought a Sep strangle further OTM.

Legal Stuff:
http://www.livevolpro.com/help/disclaimer_legal.html

Satyam (SAY) - Long Term Vol Seller Looks Attractive

SAY is trading $5.26, with IV30™ up 6.1%. The LIVEVOL™ Pro Summary is below.


The company has traded over 10,100 options in the first three hours on total daily average option volume of just 430. Essentially all the volume was an Apr'11 5 straddle sale 5,000x (10,000 contracts). The Stats Tab and Day's biggest trades snapshots are included (click either image to enlarge).


The Options Tab (click to enlarge) illustrates that the calls and puts are mostly opening (compare OI to trade size). Note also that Apr vol is 52 (ish). vs. Oct (63) and Jan'11 (56) which are higher.


The Skew Tab snap (click to enlarge) illustrates the vols by strike by month.


I've highlighted the 5 strike. The Skew has a bend upward as the 7 strike calls are quoting at 53 vol.

Finally, the Charts Tab (6 months) is below (click to enlarge). The top portion is the stock price, the bottom is the vol (IV180™ - orange vs HV180™ - pink).


This is interesting. We can see the long term implied (53) is trading more than 17 points above the long term realized (36). This vol difference has been apparent for ~5 months, and is as wide as it's been right now. The stock price itself has risen of late, from ~$4.50 to $5.25 over the last three weeks.

Trade Stats
Sell 5,000 Apr'11 5 straddles @ $1.45
This is a 46.5 vol sale, so it's still ~10 points above the long term realized. I like selling this vol, but am also hesitant about $5 stocks in this new found merger happy world.

Selling this straddle smaller than 5,000x yields better prices (and vols). I see an Apr'11 5 straddle sale @ $1.55. Buying the Apr'11 6 calls for $0.55, yields a $1.00 credit, no upside risk, and naked downside < $4. The 52 wk price range for SAY is [$4.13, $6.84], so < $4 would be an annual low.

One other thing to consider is how much margin this might eat into for an extended period of time. A Jan'11 2.5 put purchase for $0.05 could help that problem out a touch.

This is trade analysis, not a recommendation.

Legal Stuff:
http://www.livevolpro.com/help/disclaimer_legal.html

Wendy's (WEN) - Bullish Bets Pile On With Naked Downside

WEN closed at $4.69 on Friday, up 4.2%. The LIVEVOL™ Pro Summary is below.


This is in the context of: Burger King (BKC) - Did Somebody Front Run the News

The company traded over 53,000 options on Friday on total daily average option volume of just 2,670. 50,000 of those contracts went up in a Jan'11 4/5 risk reversal (sold puts/bought calls). The Stats Tab and Day's biggest trades snapshots are included (click either image to enlarge).


The Options Tab (click to enlarge) illustrates that the OI in both lines is as large (or larger) than the trade volume, so there is an ambiguity as to whether or not this was opening. As of today the OI in the calls went up to 51,830 and the OI in the puts went up to 67,083. This trade was opening on an already massive bet.


Finally, the Charts Tab (6 months) is below (click to enlarge). The top portion is the stock price, the bottom is the vol (IV30™ - red vs HV20™ - blue vs. HV180™ - pink). The yellow shaded area at the very bottom is the IV30™ vs. the HV20™ vol difference.


We can see an abrupt move upward of late. On 8-31-2010 WEN was $3.91. As of 9-10-2010 it got as high as $4.73, or more than 20% in two weeks. The IV30™ is 56 compared to the HV20™ of just 40. The longer term realized vol is just 36, so short term vol is definitely elevated.

The big trade on Friday sold 46 vol and bought 54 vol (note that the calls traded at substantially higher vol than the puts). With HV180™ at 36, this is a purchase of elevated vol, though it is spread off. The stock has a 52 wk range of [$3.83,$5.55].

Trade Stats
The trade nets 3*$0.20 - 2*$0.50 = $0.40 debit ($400,000). It's bullish and naked short downside. The OI taken together is substantially bullish in Jan'11 and substantially naked the downside.

This is trade analysis, not a recommendation.

Legal Stuff:
http://www.livevolpro.com/help/disclaimer_legal.html