Friday, September 10, 2010

Hartford (HIG) - Sep Calls Trade Size; Skew Turns Huge

HIG is trading $22.93, up 2.7% with IV30™ 17.1%. The LIVEVOL™ Pro Summary is below.


The company has traded over 64,000 options on total daily average option volume of just 8,502. The action is in Sep calls, with over 40,000 trading in the front month, yielding a 13:1 call:put ratio. The Stats Tab and Day's biggest trades snapshots are included (click either image to enlarge).


The Options Tab (click to enlarge) illustrates that the calls are all mostly opening (compare OI to trade size). I'm actually not quite clear if it's buying/selling, but the vol is jumping and the skew is aggressively bent.


The Skew Tab snap (click to enlarge) illustrates the vols by strike by month.


Note the Sep upside skew is wildly bid. The Sep 29 calls are $0.06 bid, or 101 vol on ATM vol of just 48.5 in Sep. The Sep 25 calls are 64 vol, which is still well above ATM, but also demonstrates how steep the reverse skew is.

Finally, the Charts Tab (6 months) is below (click to enlarge). The top portion is the stock price, the bottom is the vol (IV30™ - red vs HV20™ - blue vs. HV180™ - pink). The yellow shaded area at the very bottom is the IV30™ vs. the HV20™ vol difference.


So they IV30™ is popping but still below the short term realized move. Both short term realized (58) and IV30™ (52) are well above the long term HV of 44.

As far as I can tell, there is some Dutch auction for some deep warrants going on. Warrants increase the float.

Possible Trades to Analyze

First, make sure to understand the auction and the warrants. Second... do the same thing again. Selling the upside in Sep covering with something, whether that's Sep lower calls or doing it in Oct seems like a reasonable bet to analyze.

This is trade analysis, not a recommendation.

Legal Stuff:
http://www.livevolpro.com/help/disclaimer_legal.html

ArcSight (ARST) - Vol Diff Gaps in Front Two Months. One Week Bet Opens Up.

ARST is trading $35.50, with IV30™ down 4.3%. The LIVEVOL™ Pro Summary is below.


--------------------
On 8-26-2010, this was the news:
(Reference from TheStreet.com:Full Story)
CUPERTINO, Calif. (TheStreet) -- Shares of security software maker ArcSight(ARST) surged almost 30% Thursday following a news report that the company is up for sale.

ArcSight Incorporated| ARST International Business Machines Corp| IBM EMC Corporation| EMC The Wall Street Journal reports that ArcSight has put itself on the auction block. Citing people familiar with the matter, the Journal says that potential buyers, including Oracle(ORCL) and Hewlett-Packard(HPQ) could pay up to $1.5 billion for the company. EMC(EMC), IBM(IBM) and CA(CA) are also possible purchasers, it added.
--------------------

The stock went from $28.23 to $36.63 in one day.

I found ARST with a custom scan I built:
Last Stock Price >= $5
Front Month - Second Month IV >= 7 points
Average Option Volume >= 1,000
Industry <> Bio-tech
Days After Earnings >= 5 and <= 70

The Livevol Pro Options Tab is included below.


We can see that Sep vol is up 2 points today while Oct vol is down 1.3. There was already a substantial difference between second and front month vol, today that divergence opened up more than three more points.

The Skew Tab snap (click to enlarge) illustrates the vols by strike by month and makes the point even more clearly.


I've highlighted the vol difference between the ATM Sep and Oct options. As of writing, a 21 point vol difference.

Finally, the Charts Tab (6 months) is below (click to enlarge). The top portion is the stock price, the bottom is the vol (IV30™ - red vs HV20™ - blue vs HV180™ - pink). The yellow shaded area at the very bottom is the IV30™ vs. the HV20™ vol difference.


We can see the gap up on the possible takeover news. When a takeover price for a stock is set, vol usually gets crushed as the expectation is that the stock will trade in a relatively tight range. That means being long vega can be a massive loser. Having said that...

Possible Trades to Analyze
Given the sharp difference in vols between the second and first months, a purchase of the Oct ATM straddle and a sale of the Sep ATM straddle is interesting.

Trade Stats:
Buy 1 Oct 35 straddle for $5.30
Sell 1 Sep 35 straddle @ $3.25
Total debit is $2.05.

This loses if there is a takeover or if the stock moves huge (like it did 8-26) in a day), vol crushes and the position is left long vega which goes to zero. It wins if the stock stays put right here for a week (i.e. through expo), then the position is left with an Oct ATM straddle for only $2.05.

It's an interesting bet with well defined risk.

This is trade analysis, not a recommendation.

Legal Stuff:
http://www.livevolpro.com/help/disclaimer_legal.html

Thursday, September 9, 2010

VXX - How the Options Market Isn't Buying the Rally

VXX (VIX Short-Term Futures) is trading $18.72, with IV30™ down 3.5% to 66.32. The LIVEVOL™ Pro Summary is below.


So the market is up, vol is down and VXX is super down over the last few months from 31.66 down to 18 (ish). The Charts Tab for the recent few months is included (click to enlarge).


During this same time period, the market hasn't been ripping, it's just been bouncing. I've included the S&P 500 chart for the last few months, note the horizontal line on top illustrating where the market has bounced back down off of cyclical highs.


So vol has declined in a period where the market has muddled around, it has not been a matter of a market headed straight up. The question isn't so much where we've been, but of course, where we're going. Let's look at the VXX Skew on 7-21-2010. It's just a random date I chose over the last few months, but it's pretty representative of the skew shape over this time frame (click to enlarge).


The skew looked quite flat, indicating an option market implication of lessened tail risk. And, as we have seen, this implication was correct over the short term. Now let's take a look at the VXX skew as of yesterday (click to enlarge).


We can see now that the VXX skew is pronounced and steep relative to the mid summer. A part of the muted skew in July was the summer doldrums, where vol often drops. The point now is that as the market is reaching it's cyclical/technical highs, this time, the VXX skew is pricing substantive tail risk. In other words, the option market isn't buying the recovery relative to summer. Hmm...

Note also, the overall level of IV30™ for the VXX is 65.62. For perspective, the 52 wk range is [55.91, 93.11]. So, while skew is expensive, vol is relatively cheap.

This is trade analysis, not a recommendation.

Legal Stuff:
http://www.livevolpro.com/help/disclaimer_legal.html

Corinthian Colleges (COCO) - Takeover Chatter Pops Vol. Stock Off Year Lows

COCO is trading $5.34, up 9.0% with IV30™ up 18.7% (14.4 vol points). The LIVEVOL™ Pro Summary is below.


Takeover chatter and a bold Nov call purchase in the 5 and 7.5 lines pushed the stock up quickly intra-day. Mike Bristow from Vtrader Group gave me color. The Livevol Pro Tick Chart is included below (click to enlarge).


The company has traded over 21,000 options on total daily average option volume of just 5,334. All but 1,709 contracts have been calls. The largest trades have been the Nov 5/7.5 call stupid, as well as Oct 6 call buying more than 5,000x. The Stats Tab and Day's biggest trades snapshots are included (click either image to enlarge).


The Options Tab (click to enlarge) illustrates that all the calls are mostly opening (compare OI to trade size). We can also see that the Sep, Oct and Nov vols are ripping up 17, 14.2 and 6.6 points respectively (top of tab)


COCO, EDMC and ESI have each fallen to 52 wk lows, well off their year highs. The risk in these stocks has been the loans. They have become sort of the sub-prime of student loans according to a few. Legislation is on the hill which could have a substantive impact on how these companies make money moving forward. Consolidation is a reasonable bet. I have included the Charts Tab comparison stock (underlying only) for all three (click to enlarge).


We can see COCO has performed the worst of this group over the last 6 months. Generally I feel like takeover chatter is non-sense. I think the reaction has been so pronounced for COCO for a few reasons:

1) The stock(s) are at year lows, so any kind of good news feels bounce worthy.
2) We are entering a time when M&A seems to be picking up. If that's true, anything is possible and chatter feels more like news.
3) The options trades with the news, in particlaurl the Nov 5/7.5 call stupid was size enough to feel like a big bet, rather than the accumulation of many small bets.

The skew in COCO is relatively tame, it's just the vol in general that's now quite elevated day over day. HV180™ is 63, IV30™ is 93. But, HV20™ is 130. In other words, the long term HV feels "unrelated" to near term realized and implied moves.

This is trade analysis, not a recommendation.

Legal Stuff:
http://www.livevolpro.com/help/disclaimer_legal.html

Newell Rubbermaid (NWL) - Call Buyers Push Skew

NWL closed yesterday at $16.16. The LIVEVOL™ Pro Summary is below.


The company traded over 8,800 options on total daily average option volume of just 646. All but 111 contracts were calls, yielding a 78:1 call:put ratio. The heaviest volume was in the Sep 17.5 calls, and Oct 16 and 17 calls. The Stats Tab and Day's biggest trades snapshots are included (click either image to enlarge).


The Options Tab (click to enlarge) illustrates that the Oct lines were substantially opening interest (compare OI to trade size). The Sep call OI was 1,510 yesterday and has changed to 2,027 today. I believe that interest is long. So 500 of those calls opened. We can also see that Sep vol was up nearly 8 points (~28%) and Oct vol was up 1.1 points (3.4%) from the buying interest. i.e. Stock up and vol up.


The Skew Tab snap (click to enlarge) illustrates the vols by strike by month.


The Oct order flow has pushed the upside skew upward, creating a parabola. The nickel bid in the Oct 20 calls makes the upward swing seem larger than maybe it truly is. The 52 wk range for this stock is just [$13.11, $17.96]. That means in order for any of the bid calls (18,19,20) to be ITM by Oct expo., the stock would need to hit a new year high by third week of Oct. That's curious order flow.

Finally, the Charts Tab (6 months) is below (click to enlarge). The top portion is the stock price, the bottom is the vol (IV30™ - red vs HV20™ - blue vs. HV180™ - pink). The yellow shaded area at the very bottom is the IV30™ vs. the HV20™ vol difference.


The stock has stayed range bound for a while now. The IV30™ has popped to 34 while the long term HV180™ is just 27 and the shorter term HV20™ is 27. So, Oct vol is elevated relative to realized. We are projecting earnings after Oct expo, so it's not an earnings vol differnce (I think).

Possible Trades to Analyze
If you're bullish on this name and want to buy calls, selling either the 18 or 20 calls against it could makes sense. A 20 strike call sale is selling 45 vol, but then again, it's a baby call. Paying $0.75 or less in the Oct 16/19 call spread buys 33 (ish) vol and sells 40 (ish) vol. Other than that, naked vol sales may also be up here.

This is trade analysis, not a recommendation.

Legal Stuff:
http://www.livevolpro.com/help/disclaimer_legal.html

Wednesday, September 8, 2010

Netezza (NZ) - Stock Rips, Vol Explodes on Takeover Chatter

NZ is trading $23.79, up 11.5% with IV30™ exploding, up 28.4%. The LIVEVOL™ Pro Summary is below.


---------------------
Here is the news from Barron's Eric Savitz:
(Click Here to Read)

Netezza (NZ) shares are trading sharply higher amid renewed takeover speculation.

TheFlyOnTheWall.com notes that the data warehousing company’s stock has been goosed by news that it canceled a planned dinner with investors. (But the subscription-based news site says that a previous rumor that the company had canceled a conference appearance was incorrect.)

As I noted in a post yesterday, Oppenheimer analyst Ittai Kidron thinks NZ could be a potential acquisition target for a number of companies, including Dell, IBM and Hewlett-Packard.
---------------------

The company has traded over 9,500 options on total daily average option volume of just 261. The action is in Sep, buying interest in the Sep 25 calls and the 22.5 puts. The Stats Tab and Day's biggest trades snapshots are included (click either image to enlarge).


The Options Tab (click to enlarge) illustrates that the calls and puts are mostly opening (compare OI to trade size).


The OI in the calls is 8.. eight...?... The puts have 11 OI. The Sep vol is up 34 points today (~50%) while Oct vol is up 16 points.

Finally, the Charts Tab (6 months) is below (click to enlarge). The top portion is the stock price, the bottom is the vol (IV30™ - red vs HV20™ - blue vs HV180™ - pink). The yellow shaded area at the very bottom is the IV30™ vs. the HV20™ vol difference.


Note how the stock has ripped since earnings a few days ago. The IV has jumped of late as well. This is similar (though more pronounced) than the BRCD action I posted yesterday. Click to read: Brocade (BRCD) - Stock Up, Vol Pops & Skew Goes Backwards on Takeover Rumors.

Interestingly, the vol is so high in the options that the skew isn't actually bent upwards, it's just high everywhere. The ATM straddle in Sep is trading 103 vol while the long term historical vol is just 61. Whoa...

This is trade analysis, not a recommendation.

Legal Stuff:
http://www.livevolpro.com/help/disclaimer_legal.html

AnnTaylor Stores (ANN) - Straddle Seller in Oct

ANN is trading $17.26, up 2.6% today with IV30™ down nearly 5%. The LIVEVOL™ Pro Summary is below.


The company has traded over 5,900 options in the first three hours on total daily average option volume of just 1,557. The largest trade was an Oct 17 straddle sale @ $2.40 ~1,500x. Color provided by Mike Bristow, Vtrader Group. In total, I see that straddle traded nearly 3,000x. The Stats Tab and Day's biggest trades snapshots are included (click either image to enlarge).


The Options Tab (click to enlarge) illustrates that the calls and puts are mostly opening (compare OI to trade size). The Oct vol is down 2.7 points and is now the lowest of all the monthly vols. The straddle sold ~54.5 vol.


The Skew Tab snap (click to enlarge) illustrates the vols by strike by month.


It's interesting to see that Sep and Oct have an upward bend to the upside skew. Dec is flat (normal).

Finally, the Charts Tab (6 months) is below (click to enlarge). The top portion is the stock price, the bottom is the vol (IV30™ - red vs HV20™ - blue and HV180™ - pink). The yellow shaded area at the very bottom is the IV30™ vs. the HV20™ vol difference.


IV30™ is 55, HV20™ is 54 and long term historical is 57. Since the straddle sold 54.5 vol, it feels kind of fair. Not real exciting either way.

Trade Stats
Sell 2,700 Oct 17 straddles @ $2.40
Breakeven Low: $14.60
Breakeven High: $19.40
ANN 52 wk range is [$11.59, $25.24]

I pretty much have no opinion on this trade one way or the other. I guess that means, I don't like it...

This is trade analysis, not a recommendation.

Legal Stuff:
http://www.livevolpro.com/help/disclaimer_legal.html

Nucor (NUE) - Oct Calls Bought, Sep Skew Turns

NUE closed $39.38 yesterday, with vol on the rise. The LIVEVOL™ Pro Summary is below.


Nucor Corporation (Nucor) along with its affiliates is engaged in the business of manufacturing of steel and steel products, with operating facilities and customers primarily located in North America.

Jeff Kearns from Bloomberg sent me this headline (By Arie Shapira):
High-beta steel stocks [...] may rally near term on reports of China steel capacity cuts.

The company traded over 24,000 options yesterday on total daily average option volume of just 6,244. The action was focused in the Oct 40 calls, where more than 12,000 traded; substantially purchases. The Stats Tab and Day's biggest trades snapshots are included (click either image to enlarge).


The Options Tab (click to enlarge) illustrates that the calls are mostly opening (compare OI to trade size). Note that Oct vol is higher than both Sep and Jan'11.


The Skew Tab snap (click to enlarge) illustrates the vols by strike by month.


We can see how the Sep upside is bid, bending upwards to the buying interest in Oct. The Oct options are yet to react substantially.

Finally, the Charts Tab (6 months) is below (click to enlarge). The top portion is the stock price, the bottom is the vol (IV30™ - red vs HV20™ - blue). The yellow shaded area at the very bottom is the IV30™ vs. the HV20™ vol difference.


We can see the stock has been on the rise in the near term, going from $36 up to over $38 in the last two weeks. Also note that IV30™ has spiked past HV20™ as of yesterday. Check out the green colored volume bar at the bottom. This indicates customer opening order call purchases This buying interest pushed vol up.

Trades to Analyze
This is an infrastructure stock, with bullish action. Though Oct vol is the highest, it's the upside in Sep that's really high. A small calendar is interesting. Maybe Sep/Oct 41 or 42 call spread, selling Sep. Really anything that sells that little kink in the skew and covers with lower vol is a candidate for further analysis. I think this trade is only interesting if there is at least a two point vol difference in the spread.

This is trade analysis, not a recommendation.

Legal Stuff:
http://www.livevolpro.com/help/disclaimer_legal.html

Tuesday, September 7, 2010

BMC Software (BMC) - Upside Skew and Bearish Bets

* UPDATE

This is an update to the article I wrote for TheStreet.com which was later posted on Yahoo! Finance: An Unusual Opportunity in BMC

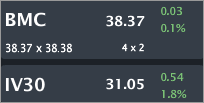
BMC is trading $38.37, basically unchanged with IV30™ up 1.8%. The LIVEVOL™ Pro Summary is below.


On 8-19-2010 I wrote that with BMC trading $37.11:
"BMC has traded over 4500 contracts in the first hour today on total daily average volume of just 1096. In particular, the September 37 calls have traded 2200+ times; substantial buying interest. This order flow has created a trading opportunity in the skew."

The skew chart from that day is included below.


We can see the obvious kink in the upside on the bullish order flow. Today the company has traded over 11,000 options on total daily average option volume of just 1,205. However, the largest trade looks like an Oct 37/38 risk reversal (buy puts/sell calls) 5,000x accounting for 10,000 contracts. This is bearish order flow. The Stats Tab and Day's biggest trades snapshots are included.


The Options Tab (click to enlarge) illustrates that both legs of the risky are mostly opening (compare OI to trade size).


The Skew Tab snap (click to enlarge) illustrates the vols by strike by month.


What's interesting to note is that the Sep skew is still bent upwards - forming a parabola rather than a smirk.

Finally, the Charts Tab (6 months) is below (click to enlarge). The top portion is the stock price, the bottom is the vol (IV30™ - red vs HV20™ - blue). The yellow shaded area at the very bottom is the IV30™ vs. the HV20™ vol difference.


We can see how the stock has stayed range bound, though recently it certainly has risen. In mid August this was a $34.50 (ish) stock.

Possible Trades to Analyze
Selling that upside in Sep in a spread is still a possibility. A 38/40 call spread for less than $0.75 is a bullish play with a vol scalp. 1 x 2 is more of a vol play, naked the upside and losing above $42.

A time spread could be in play. Maybe buy the Oct 40 calls, sell the Sep 40 calls. Doing that 1 x 2 does more of the same, sells higher vol, but also risks naked upside.

For you bears, a risk reversal selling Sep calls and buying Oct puts could work. If the Sep calls expire worthless, you can sell the same calls again in Oct for two premium collections.

This is trade analysis, not a recommendation.

Legal Stuff:
http://www.livevolpro.com/help/disclaimer_legal.html