Friday, August 30, 2013
Caesars Entertainment (CZR) - Vol Pops as Stock Falls 80%, then Rises 500%; Why is Sep Volatility so Cheap?
CZR is trading $21.77, down 0.32% with IV30™ popping 10.8%. The LIVEVOL® Pro Summary is below.
Caesars Entertainment Corporation provides casino entertainment services. Its casino entertainment facilities include land-based casinos, riverboat or dockside casinos, managed casinos, combination greyhound racetrack and casino, combination thoroughbred racetrack and casino, and harness racetrack and casino, hotel and convention space, restaurants, and non-gaming entertainment facilities.
First, on a totally random point, shouldn't the firm name be Caesar's with an apostrophe? What's up with that... Anyway, I digress...
I found this stock using a real-time custom scan. This one hunts for vol gainers on the day. But this note is actually focused on depressed vol and an exploding stock price. CZR is actually the only company to appear on the screen today.
Custom Scan Details
Stock Price GTE $5
IV30™ GTE 30
IV30™ Percent Change GTE 10
Average Option Volume GTE 1,200
IV30™ Change GTE 7
The two-year CZR Charts Tab is included (below). The top portion is the stock price; the bottom is the vol (IV30™ - red vs HV20™ - blue vs HV180™ - pink).
On the stock side we can see two pieces to a single chart:
(1) The first part sees the stock drop from ~$18 to ~$4.50. So just a cataclysmic implosion with the firm nearing bankruptcy levels.
(2) The rise from $4.50 to now ~ $22, an incredible reversal seeing a stock rise to 550% of its prior value in less than a year.
The stock is now at an all-time high. But this is also a volatility note, so let’s look to the two-year IV30™ chart in isolation, below.
We can see the spike in the implied today, but really, that’s not the story. This stock has seen implied vol over 120% in the last year and now trades at volatility in the 70% range. Given the schizophrenic stock movement over the last two-years, I dunno about 70% vol. That’s just I the 25th percentile for the year and the stock is ripping right now. At the end of June, this was a $12 stock…
Finally, let's look to the Options Tab (below).
Across the top we can see that Sep vol is well depressed at 69.39% while Oct and Dec pop over 80%. My focus is on that short-term volatility in the Sep expiry. What’s going on there?
This is trade analysis, not a recommendation.
Follow @OphirGottlieb
Tweet
Legal Stuff:
Options involve risk. Prior to buying or selling an option, an investor must receive a copy of Characteristics and Risks of Standardized Options. Investors need a broker to trade options, and must meet suitability requirements.
The information contained on this site is provided for general informational purposes, as a convenience to the readers. The materials are not a substitute for obtaining professional advice from a qualified person, firm or corporation. Consult the appropriate professional advisor for more complete and current information. I am not engaged in rendering any legal or professional services by placing these general informational materials on this website.
I specifically disclaim any liability, whether based in contract, tort, strict liability or otherwise, for any direct, indirect, incidental, consequential, or special damages arising out of or in any way connected with access to or use of the site, even if I have been advised of the possibility of such damages, including liability in connection with mistakes or omissions in, or delays in transmission of, information to or from the user, interruptions in telecommunications connections to the site or viruses.
I make no representations or warranties about the accuracy or completeness of the information contained on this website. Any links provided to other server sites are offered as a matter of convenience and in no way are meant to imply that I endorse, sponsor, promote or am affiliated with the owners of or participants in those sites, or endorse any information contained on those sites, unless expressly stated.
Thursday, August 29, 2013
Methode Electronics (MEI) - Stock Explodes to Decade High on Earnings; Pre-earnings Trading Very Suspicious
MEI is trading $23.50, up 33.3% with IV30™ popping 20.9%. The LIVEVOL® Pro Summary is below.
Methode Electronics, Inc., is a manufacturer of component and subsystem devices. The Company operates in four segments: automotive, interconnect, power products, and other. The Company designs, manufactures and markets devices employing electrical, radio remote controls, electronic, wireless and sensing technologies.
MEI is the single largest stock gainer today and pushed the stock to decade highs off of an earnings release that shocked everyone... Well, almost everyone... I believe that the order flow leading up to the earnings release does in fact reveal potential malfeasance – that is, the use of insider information to garner illegal profits. But this one is tricky – in so many ways.
Let’s get started with the Stats Tab, below.
Just one thing I want to note here, which is that the firm averages 36 total option contracts traded a day – that’s a three month (60 trading day) average. Those 36 contracts breakdown to average:
(1) 29 calls traded a day
(2) 7 puts traded a day
OK, keep those tiny numbers in mind as we walk through this analysis. This is a diagnosis, but first we need a symptom.
Let’s turn to the Options Tab as of right now, and look at the OI in the Sep 17.5 calls.
I’ve highlighted the strike in question. I first noted that the OI was pretty large for this name, in fact the total sum of the OI in all of Sep is 372, so those calls are 182% of the other OI in Sep (240 vs. 132).
OK, that’s the symptom.
Here’s the diagnosis.
The OI in those calls looked like this over the last few days:
8-26-2103: OI = 1
8-27-2103: OI = 115
8-28-2103: OI = 215
8-29-2103: OI = 240
Hmmm... The firm averages 29 calls traded a day yet the Sep 17.5 calls alone traded over 100x on 8/26 and 8/27 with earnings out on 8/29.
Well, what about those calls? On 8-27-2013 100 traded, but on the bid. So, they were probably sales, right? No, absolutely wrong. I hope you have LIVEVOL® Pro, but if you don't, watch this.
Here is the Time & Sales snapshot from that day for those calls, and then the real analysis.
OK, there’s one hundred trading $0.80 on the bid. But, check this out. Let’s look at the level II quotes at the time of the trade.
Look at PHLX. The NBBO before the trade was $0.65 x $0.85, then on PHLX someone posted a bid of $0.80 and that bid was hit. This type of trading does two things:
(1) Allows for a better execution than simply lifting the offer (which would have cost $0.85)
(2) It hides the trade by looking like it traded on the bid and was therefore a sale.
But this wasn’t a sale – we can see clearly that the initiator bid up the options and got their fill for $0.80. Was that just a coincidence? Well, let’s look at the day before.
I have included the same level II quotes at the time of a trade on 8-26-2013, below.
Here we see the NBBO was $0.85 x $1.20 before the trade then someone bid $1.15 and the offer dropped to $1.15 to match it. Again, that’s a hidden trade.
All in all, I see 239 Sep 17. Calls bought for ~$0.85 a few days prior to an earnings blowout that pushed the stock to a decade high stock price.
Total paper profits: 239 x 100 x ($6.00 - $0.85) = $123,085 on a $20,000 bet or a 600% gain in three days. How convenient...
This is trade analysis, not a recommendation.
Follow @OphirGottlieb
Tweet
Legal Stuff:
Options involve risk. Prior to buying or selling an option, an investor must receive a copy of Characteristics and Risks of Standardized Options. Investors need a broker to trade options, and must meet suitability requirements.
The information contained on this site is provided for general informational purposes, as a convenience to the readers. The materials are not a substitute for obtaining professional advice from a qualified person, firm or corporation. Consult the appropriate professional advisor for more complete and current information. I am not engaged in rendering any legal or professional services by placing these general informational materials on this website.
I specifically disclaim any liability, whether based in contract, tort, strict liability or otherwise, for any direct, indirect, incidental, consequential, or special damages arising out of or in any way connected with access to or use of the site, even if I have been advised of the possibility of such damages, including liability in connection with mistakes or omissions in, or delays in transmission of, information to or from the user, interruptions in telecommunications connections to the site or viruses.
I make no representations or warranties about the accuracy or completeness of the information contained on this website. Any links provided to other server sites are offered as a matter of convenience and in no way are meant to imply that I endorse, sponsor, promote or am affiliated with the owners of or participants in those sites, or endorse any information contained on those sites, unless expressly stated.
Wednesday, August 28, 2013
FedEx Corporation (FDX) - Volatility Breaches Annual High Well Ahead of Earnings; Market BellWether Risk is Here
FDX closed Wednesday trading at $108.50, up small with the 30-day implied volatility closing at 29.08%. The Charles Schwab optionsXPRESS Symbol Summary is included below.
Provided by Charles Schwab optionsXPRESS
I found this stock using an elevated volatility scan ad it's a follow up to the post I wrote on 8-25-2013. You can read that post by clicking on the title, below:
No Noise, Here are the Facts, and Why: The Market Will Go Up. The Market Will Go Down.
FDX is bellwether, and the option market is reflecting elevated volatility well ahead of earnings due out in mid Sep.
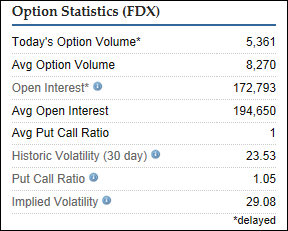
I've included the Options Statistics for FDX, below.
Provided by Charles Schwab optionsXPRESS
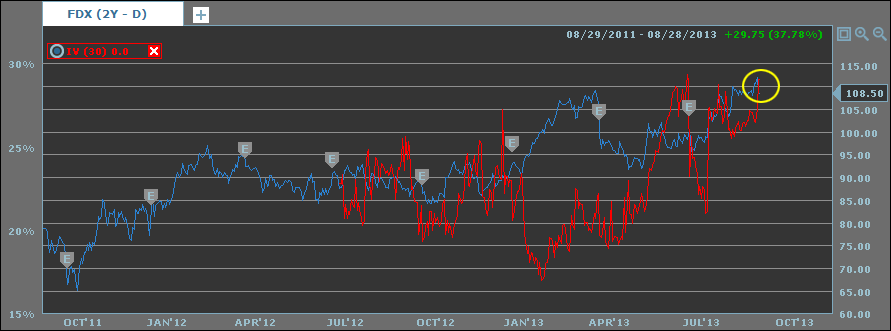
The two-year FDX Charts Tab is included (below). The blue portion is the stock price, the red is the 30-day implied vol.
Provided by Charles Schwab optionsXPRESS
On the stock side we can see that the price is right at a multi-year high. In fact, two-years ago this was a sub $80 stock and just a few months ago it was trading at ~$93. But it's the vol that caught my eye.
Check out the red line (the 30-day implied). In Jan the implied was trading in the 17% range, today it closed above 29% and is essentially at a multi-year high. The next earnings release for FDX is 9-18-2013, so just before Sep expriy. Volatility should rise into that event, and we're already at multi-year highs.
FDX is another one of those socks that measures much more than its own results when earnings come out, but rather an evergreen type of measure like WMT, HD, etc. As I alluded to in the prior post on 8-2-2013, retailers looked terrible (Walmart (WMT), Macy’s (M), Nordstrom (JWN), Target (TGT) and Staples (SPLS)) but the do-it-yourself guys (HD and LOW) were booming. So we're squarely in "I don't know land." It's the same picture in housing where we have two phenomena:
1. The latest data show existing home sales — which account for more than 90% of the housing market — are up 17% from the levels of last summer.
2. The latest data also show that new-home sales, which have less of a lag than the existing-home numbers and may better reflect real-time conditions, fell unexpectedly to a nine-month low.
"I don't know land" means uncertainty, and that means risk. For FDX, that means a multi-year high in the implied well ahead of earnings. It would not surprise me to see the implied for FDX go well in to the 30%-35% range -- a level not reached in over a year.
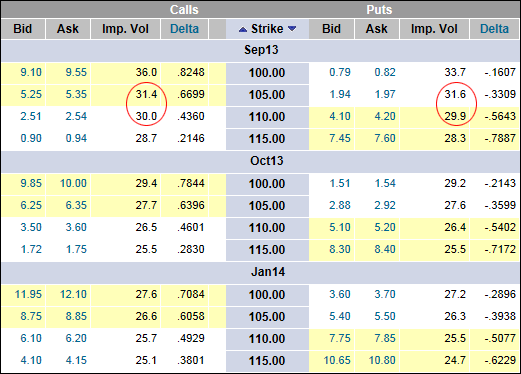
Finally, let's look to the Options Tab (below).
Provided by Charles Schwab optionsXPRESS
I've highlighted the front month vol which is actually over 30%. Oct is priced to around 27%. Obviously the difference is earnings, and that vol diff will open up substantially as we get closer to that Sep 18th date. Maybe FDX will provide some data that's more definitive, good or bad. But for now, it's reflecting uncertainty -- as well it should.
This is trade analysis, not a recommendation.
Follow @OphirGottlieb
Tweet
Legal Stuff:
Options involve risk. Prior to buying or selling an option, an investor must receive a copy of Characteristics and Risks of Standardized Options. Investors need a broker to trade options, and must meet suitability requirements.
The information contained on this site is provided for general informational purposes, as a convenience to the readers. The materials are not a substitute for obtaining professional advice from a qualified person, firm or corporation. Consult the appropriate professional advisor for more complete and current information. I am not engaged in rendering any legal or professional services by placing these general informational materials on this website.
I specifically disclaim any liability, whether based in contract, tort, strict liability or otherwise, for any direct, indirect, incidental, consequential, or special damages arising out of or in any way connected with access to or use of the site, even if I have been advised of the possibility of such damages, including liability in connection with mistakes or omissions in, or delays in transmission of, information to or from the user, interruptions in telecommunications connections to the site or viruses.
I make no representations or warranties about the accuracy or completeness of the information contained on this website. Any links provided to other server sites are offered as a matter of convenience and in no way are meant to imply that I endorse, sponsor, promote or am affiliated with the owners of or participants in those sites, or endorse any information contained on those sites, unless expressly stated.
Provided by Charles Schwab optionsXPRESS
I found this stock using an elevated volatility scan ad it's a follow up to the post I wrote on 8-25-2013. You can read that post by clicking on the title, below:
No Noise, Here are the Facts, and Why: The Market Will Go Up. The Market Will Go Down.
FDX is bellwether, and the option market is reflecting elevated volatility well ahead of earnings due out in mid Sep.
I've included the Options Statistics for FDX, below.
Provided by Charles Schwab optionsXPRESS
The two-year FDX Charts Tab is included (below). The blue portion is the stock price, the red is the 30-day implied vol.
Provided by Charles Schwab optionsXPRESS
On the stock side we can see that the price is right at a multi-year high. In fact, two-years ago this was a sub $80 stock and just a few months ago it was trading at ~$93. But it's the vol that caught my eye.
Check out the red line (the 30-day implied). In Jan the implied was trading in the 17% range, today it closed above 29% and is essentially at a multi-year high. The next earnings release for FDX is 9-18-2013, so just before Sep expriy. Volatility should rise into that event, and we're already at multi-year highs.
FDX is another one of those socks that measures much more than its own results when earnings come out, but rather an evergreen type of measure like WMT, HD, etc. As I alluded to in the prior post on 8-2-2013, retailers looked terrible (Walmart (WMT), Macy’s (M), Nordstrom (JWN), Target (TGT) and Staples (SPLS)) but the do-it-yourself guys (HD and LOW) were booming. So we're squarely in "I don't know land." It's the same picture in housing where we have two phenomena:
1. The latest data show existing home sales — which account for more than 90% of the housing market — are up 17% from the levels of last summer.
2. The latest data also show that new-home sales, which have less of a lag than the existing-home numbers and may better reflect real-time conditions, fell unexpectedly to a nine-month low.
"I don't know land" means uncertainty, and that means risk. For FDX, that means a multi-year high in the implied well ahead of earnings. It would not surprise me to see the implied for FDX go well in to the 30%-35% range -- a level not reached in over a year.
Finally, let's look to the Options Tab (below).
Provided by Charles Schwab optionsXPRESS
I've highlighted the front month vol which is actually over 30%. Oct is priced to around 27%. Obviously the difference is earnings, and that vol diff will open up substantially as we get closer to that Sep 18th date. Maybe FDX will provide some data that's more definitive, good or bad. But for now, it's reflecting uncertainty -- as well it should.
This is trade analysis, not a recommendation.
Follow @OphirGottlieb
Tweet
Legal Stuff:
Options involve risk. Prior to buying or selling an option, an investor must receive a copy of Characteristics and Risks of Standardized Options. Investors need a broker to trade options, and must meet suitability requirements.
The information contained on this site is provided for general informational purposes, as a convenience to the readers. The materials are not a substitute for obtaining professional advice from a qualified person, firm or corporation. Consult the appropriate professional advisor for more complete and current information. I am not engaged in rendering any legal or professional services by placing these general informational materials on this website.
I specifically disclaim any liability, whether based in contract, tort, strict liability or otherwise, for any direct, indirect, incidental, consequential, or special damages arising out of or in any way connected with access to or use of the site, even if I have been advised of the possibility of such damages, including liability in connection with mistakes or omissions in, or delays in transmission of, information to or from the user, interruptions in telecommunications connections to the site or viruses.
I make no representations or warranties about the accuracy or completeness of the information contained on this website. Any links provided to other server sites are offered as a matter of convenience and in no way are meant to imply that I endorse, sponsor, promote or am affiliated with the owners of or participants in those sites, or endorse any information contained on those sites, unless expressly stated.
TASER Int'l (TASR) - Stock Explodes, Volatility Explodes More. Options Reflect More Upside to Come.
TASR is trading $11.30, down 4.6% with IV30™ spiking 12.8%. The LIVEVOL® Pro Summary is below.
TASER International, Inc. (TASER) is engaged in development, manufacture and sale of electronic control devices (ECDs) designed for use in the law enforcement, military, corrections, private security and personal defense markets. Federal, state and local law enforcement agencies in the United States and globally represent the target market for its TASER ECDs.
I found this stock using a real-time custom scan. This one hunts for vol gainers on the day. But there is so much more goin on with this firm in the options realm -- elevated vol and reverse skew along with a rocketing stock price. This is a juicy one...
Custom Scan Details
Stock Price GTE $5
IV30™ GTE 30
IV30™ Percent Change GTE 10
Average Option Volume GTE 1,200
IV30™ Change GTE 7
The one-year TASR Charts Tab is included (below). The top portion is the stock price, the bottom is the vol (IV30™ - red vs HV20™ - blue vs HV180™ - pink).
On the stock side we can that this was a $5.55 stock a year ago, and has more than doubled in twelve months. But more interesting is how that return evolved. First, the stock went from that $5.50 (ish) level to ~$8 on an earnings release in October of 2012. Then there was a quiet period and a nice equilibrium seemed to be reached. Then there was the last six weeks.
On 8-12-2013 this was an $8.60 stock. Today it's trading over $11, up 31% in less than two months. And is there a vol story behind the move, yeah, there is...
Let's turn to the one-year IV30™ chart in isolation, below.
We can see that the implied has popped from 42.66% on 8-2-2013, to now over 64% or a 50%+ pop in this time period (less than two months). So we see a stock popping on exploding vol, and then today we get another volatility spike. The volatility plot thickens when we turn to the Skew Tab, below.
Check out the skew shape for Sep and Oct options. it's decidedly upward sloping, which is the reverse of "normal" skew. The option market reflects substantially greater upside risk (potential) then downside risk even after a rip roaring six-week stock rise and volatility spike. So, in English, the option market reflects a greater probability of an upside move than a downside move. To learn about skew you can read this post: Understanding Option Skew -- What it is and Why it Exists
Finally, let's look to the Options Tab (below).
Across the top we can see that Sep vol is priced to 63.73% and Oct vol is priced to almost the identical level. It's Dec and Mar'15 where the volatility drops considerably. So, the option reflects elevated risk right now and for the next two-months in TASR with a decidedly upside tilt... Of course, that does not mean the stock is going up -- it means the options are priced that way, potentially due to upside speculation.
This is trade analysis, not a recommendation.
Follow @OphirGottlieb
Tweet
Legal Stuff:
Options involve risk. Prior to buying or selling an option, an investor must receive a copy of Characteristics and Risks of Standardized Options. Investors need a broker to trade options, and must meet suitability requirements.
The information contained on this site is provided for general informational purposes, as a convenience to the readers. The materials are not a substitute for obtaining professional advice from a qualified person, firm or corporation. Consult the appropriate professional advisor for more complete and current information. I am not engaged in rendering any legal or professional services by placing these general informational materials on this website.
I specifically disclaim any liability, whether based in contract, tort, strict liability or otherwise, for any direct, indirect, incidental, consequential, or special damages arising out of or in any way connected with access to or use of the site, even if I have been advised of the possibility of such damages, including liability in connection with mistakes or omissions in, or delays in transmission of, information to or from the user, interruptions in telecommunications connections to the site or viruses.
I make no representations or warranties about the accuracy or completeness of the information contained on this website. Any links provided to other server sites are offered as a matter of convenience and in no way are meant to imply that I endorse, sponsor, promote or am affiliated with the owners of or participants in those sites, or endorse any information contained on those sites, unless expressly stated.
Tuesday, August 27, 2013
salesforce.com (CRM) - Volatility Breaches Annual High into Earnings; Will Pattern of Big Moves Continue?
CRM is trading $42.42, down 2.3% with IV30™ up 6.4%. The LIVEVOL® Pro Summary is below.
salesforce.com, inc. is a provider of enterprise cloud computing and social enterprise solutions. The Company provides a customer and collaboration relationship management (CRM), applications through the Internet or cloud.
I found this stock using a real-time custom scan. This one hunts for elevated vols and CRM vol is now trading at an annual high. The firm does report earnings in two days (AMC),so elevated vol makes sense. It's the level of the volatility that caught my eye.
Custom Scan Details
Stock Price GTE $5
IV30™ GTE 30
IV30™ Percentile GTE 80
Average Option Volume GTE 1,200
The one-year CRM Charts Tab is included (below). The top portion is the stock price, the bottom is the vol (IV30™ - red vs HV20™ - blue vs HV180™ - pink).
On the stock side we can see the stock is up from $37.27 a year ago, so a ~13% return. That's a bit behind the broader indices. What I do note is the stock movement after the latest three earnings releases. note the blue "E" icons represent an earnings date. We can see how the stock has moved in the days surrounding earnings for the last three cycles, below:
(1) $35-$40
(2) $41-$46
(3) $46-$37
These are non-trivial moves in relatively short periods of time and the last one was not good... There is pent up risk in CRM earnings based on the last three results (in my opinion) so the elevated volatility makes sense.
Let's turn to the one-year IV30™ chart in isolation, below.
I've drawn in that yellow horizontal line to better illustrate how high the current vol is relative to last year. We're at annual highs and I suspect volatility will continue to rise today, tomorrow and on the 29th right up to the earnings release after the close. In any case, the market could be very "reactive" to the earnings news whether it be good, bad or 'blah'.
Finally, let's look to the Options Tab (below).
Across the top we can see Aug30 weekly options are priced to 111.61% (that's all earnings). Sep monthly vol is priced to 49.16% while Oct is priced to 40.82%. Right now those weekly options are pricing in ~$3.50 move (look at the 42.5 dollar strike). I do note that CRM has that tendency to react of of earnings, and then continue to drift in the same direction for several days after the announcement. This will be an interesting one to watch.
This is trade analysis, not a recommendation.
Follow @OphirGottlieb
Tweet
Legal Stuff:
Options involve risk. Prior to buying or selling an option, an investor must receive a copy of Characteristics and Risks of Standardized Options. Investors need a broker to trade options, and must meet suitability requirements.
The information contained on this site is provided for general informational purposes, as a convenience to the readers. The materials are not a substitute for obtaining professional advice from a qualified person, firm or corporation. Consult the appropriate professional advisor for more complete and current information. I am not engaged in rendering any legal or professional services by placing these general informational materials on this website.
I specifically disclaim any liability, whether based in contract, tort, strict liability or otherwise, for any direct, indirect, incidental, consequential, or special damages arising out of or in any way connected with access to or use of the site, even if I have been advised of the possibility of such damages, including liability in connection with mistakes or omissions in, or delays in transmission of, information to or from the user, interruptions in telecommunications connections to the site or viruses.
I make no representations or warranties about the accuracy or completeness of the information contained on this website. Any links provided to other server sites are offered as a matter of convenience and in no way are meant to imply that I endorse, sponsor, promote or am affiliated with the owners of or participants in those sites, or endorse any information contained on those sites, unless expressly stated.
Monday, August 26, 2013
Gulfport Energy (GPOR) - Stock Breaches All-time 14-year Highs; Volatility Collapses to Multi-year Lows... Huh?
GPOR is trading $58.09, up 1.7% with IV30™ down 0.6%. The LIVEVOL® Pro Summary is below.
Gulfport Energy Corporation (Gulfport) is an independent oil and natural gas exploration and production company with its principal producing properties located along the Louisiana Gulf Coast in the West Cote Blanche Bay, or WCBB, and Hackberry fields, and in West Texas in the Permian Basin.
I found this stock using a real-time custom scan. This one hunts for depressed vols. I note that the implied is at multi-year lows while the stock price is at multi-year highs; in fact all-time 14-year highs. This is yet another case where it feels like market complacency (or malaise) with respect to the option volatility has taken over.
Custom Scan Details
Stock Price GTE $5
IV30™ GTE 20
IV30™ Percentile LTE 10
Average Option Volume GTE 1,200
The two-year GPOR Charts Tab is included (below). The top portion is the stock price; the bottom is the vol (IV30™ - red vs HV20™ - blue vs HV180™ - pink).
On the stock side we can see the price is now at multi-year highs. How many years? How about an all-time high going back pre-year 2000? Yeah, that kind of multi-year high. We can see that a little more than a year ago this was a $15 stock and is now nearly 400% that level.
But what about the vol? Well, let’s turn to the two-year IV30™ chart in isolation, below.
We can see the implied hit as high as 95% in fall of two-years ago, but now is at a multi-year low, trading in the low 30% range. Incredible… yes the firm just released earnings, and yes that means a vol crush, and yes volatility goes down (generally) as stock prices rise, but no, a multi-year low in volatility does not make a lot of sense to me when it coincides with a 14-year high in stock price.
Finally, let's look to the Options Tab (below).
Across the top we can see the monthly vols are priced to 32.81% for Sep and 35.70 %for Oct. I would put a big golden star next to this name on my watchlist and watch the price action (realized volatility) relative to the implied volatility.
This is trade analysis, not a recommendation.
Follow @OphirGottlieb
Tweet
Legal Stuff:
Options involve risk. Prior to buying or selling an option, an investor must receive a copy of Characteristics and Risks of Standardized Options. Investors need a broker to trade options, and must meet suitability requirements.
The information contained on this site is provided for general informational purposes, as a convenience to the readers. The materials are not a substitute for obtaining professional advice from a qualified person, firm or corporation. Consult the appropriate professional advisor for more complete and current information. I am not engaged in rendering any legal or professional services by placing these general informational materials on this website.
I specifically disclaim any liability, whether based in contract, tort, strict liability or otherwise, for any direct, indirect, incidental, consequential, or special damages arising out of or in any way connected with access to or use of the site, even if I have been advised of the possibility of such damages, including liability in connection with mistakes or omissions in, or delays in transmission of, information to or from the user, interruptions in telecommunications connections to the site or viruses.
I make no representations or warranties about the accuracy or completeness of the information contained on this website. Any links provided to other server sites are offered as a matter of convenience and in no way are meant to imply that I endorse, sponsor, promote or am affiliated with the owners of or participants in those sites, or endorse any information contained on those sites, unless expressly stated.
Sunday, August 25, 2013
No Noise, Here are the Facts, and Why: The Market Will Go Up. The Market Will Go Down.
OK, here we go... A Dragnet, "just the facts ma'am" review of where we are and the arguments for and against a market drop (or rally). When opinion comes in, I'll state it clearly. But for now, we need some clarity, badly...
As of Sunday, August 25th, we're looking at the following levels for the broad U.S. market indices.
Source: Yahoo! Finance
And, to paint the complete picture, we're also looking at a VIX at 13.98%. I've included both the VIX quote summary and five-year chart, below, for context.
Source: Yahoo! Finance
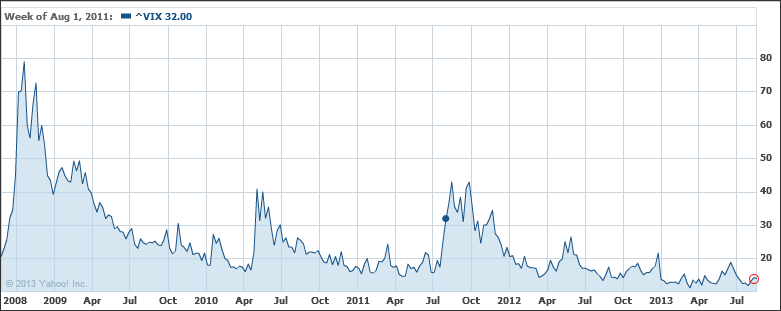
So the question is, where is the market headed? The trick is we'll get a different answer everyday based on the use of selective economic data that's needed to support a thesis. Ya know how it goes-- on down days there's always bad economic data to report, on good news there's also good economic data to report. Exhausting -- though it does sell commercial advertisements.
So who's lying?... Well nobody... Let's take a look at what's actually happening right now -- then we can decide where the market is going.
NB: The primary sources for this article are:
1. Here’s Why Bernanke and the Fed Seem Confused, via The Exchange - Friday, August 23, 2013.
2. U.S. August auto sales to rise 12 percent: J.D. Power & LMC, via Reuters – Thu, Aug 22, 2013 11:09 AM EDT.
3. United States Department of Labor
4. 7 reasons for a September crash, via MSN Money.
5. Real Wages Decline Again — Literally No One Notices, via Business Insider
Good News
The Fed is ever present and aware. Quantitative Easing has worked to achieve its primary goal of accelerating the housing recovery:
1. Home prices bottomed out in 2012 and have been rising by double-digits, year over year.
2. The latest data show existing home sales — which account for more than 90% of the housing market — are up 17% from the levels of last summer.
3. Home Depot (HD) and Lowe’s (LOW) just reported excellent earnings, thanks to home owners spending more money on appliances, fixtures and home-improvement gear.
Other Good Stuff...
4. Car sales are up: "The August annualized monthly sales rate, if realized, would be the highest since November 2007."
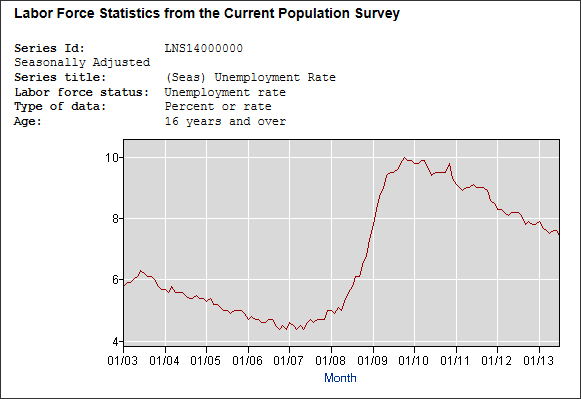
5. Unemployment has been decreasing at a staggering rate according to labor force statistics from the US Dept of Labor. I've included a 16-year chart below, and you can download the raw data from the site here: Labor Force Statistics from the Current Population Survey
Source: US Department of Labor
6. Here's the return of the major US indices over the last year and the VIX (the CBOE volatility index):
DOW: +14.96%
S&P 500: +18.65%
NASDAQ: +19.79%
VIX: -12.41%
So... home prices are up, bellwether stocks HD and LOW are up, unemployment is down substantially, car sales are at six-year highs, the major US indices are up substantially above their long-term averages and the VIX ("fear index") is down and has remained down.
The US is OK -- better than OK... Is there even an argument?... Yeah, as it turns out, there is....
Bad News
1. The Fed is unclear on its stance toward QE and tapering -- remarkably unclear. The market dropped 6% this June when Fed tapering started becoming a serious issue. Now, the Fed's Sept. 17 (and 18th) meeting looms quite large. The Fed's direction is not only unclear, it's efficacy in achieving it's main goal is also unclear. Which direction is the housing market moving? We know existing home sales are looking good but...
2. The latest data also show that new-home sales, which have less of a lag than the existing-home numbers and may better reflect real-time conditions, fell unexpectedly to a nine-month low.
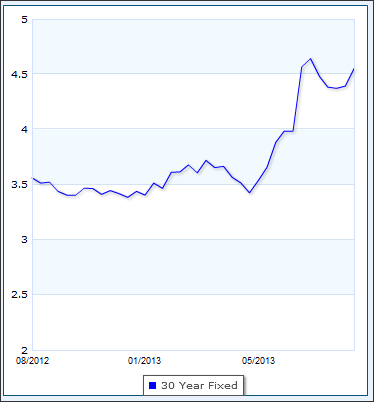
3. Interest rates are rising. That's mortgages and that means home sales (and potentially car sales). I've include a three-year chart of the 30-yr mortgage rate, below (source: BankRate.com).
Source: BankRate.com
Other Bad Stuff...
4. Aside from home-related goods, spending on most other things has been poor. Walmart (WMT), Macy’s (M), Nordstrom (JWN), Target (TGT) and Staples (SPLS) reported disappointing sales recently. "With weak growth in incomes and tax hikes taking a bigger bite out of paychecks this year, consumers don’t seem to have the money to boost spending by much. And there’s no new income source on the horizon." Lest we forget, WMT is the largest US employer.
5. Unemployment is not what it seems. In a Forbes article for 4-8-2013 entitled: "Unemployment Is Really 14.3%--Not 7.6%," we get a stark contrast to a conclusion of an apparent employment recovery. I've included some snippets below (bolding was added by me).
---
These numbers added together suggest that the true unemployment level– when part-time workers are included– is 14.3%–meaning that one in seven of every potential full-time employee in the U.S. economy is not able to earn a proper living wage–and thereby contribute to the snails-pace of economic growth.
Moreover, the percentage of people employed is only 58.5%, down from 61%, the level hit in 2008 when Obama was first elected–and to be fair before the meltdown on Wall Street. And the jump in first-time unemployment claims last week was the highest level since last November.
Source: Forbes Unemployment Is Really 14.3%--Not 7.6%
---
The unemployment data re-evaluated and the earnings from WMT, M, JWN and TGT not merely flies in the ointment of overwhelming recovery data. I'll repeat the line from the article above: "the percentage of people employed is only 58.5%, down from 61%, the level hit in 2008."
6. Beyond unemployment of course is the real wages argument, or at this point, phenomenon. Here's a snippet from Business Insider:
---
Real wages fell 0.2% in 2012, down from $295.49 (1982-84 dollars) to $294.83 per week, according to the 2013 Economic Report of the President. Thus, a 1.9% increase in nominal wages was more than wiped out by inflation, marking the 40th consecutive year that real wages have remained below their 1972 peak.
---
More specifically, even if the unemployment chart is correct, we have lower real dollar median household incomes than in 2007. Yeah, collectively, we're still poorer since before the 'Great Recession.'
7. Margin debt is "at or near all-time highs." That means investors in general are bullish but it also means they may be out of bullets. The caveat here of course is how much cash is sitting on the sidelines. The result is, for the market to go up, new cash will have to be committed... but that's actually not that "bad" or "big" of a deal unless fear builds.
8. Remember the debt ceiling debacle from last year? The downgrade of US debt by S&P? Well, we're about to do the dance again. Come the end of September, the new debt ceiling will be hit again. Last time that happened, the market spasmed down 15% and from what we see in Washington, there is no discussion at any level that is moving the two-parties toward an agreement.
Conclusion
Yeah, the Fed has been sending mixed signals. First b/c their isn't consensus within the group, second b/c their isn't consensus with the data. Is QE the only thing holding up the economy? Is it holding up the economy? Yes corporate profits are at all times highs, but with fewer people employed at and lower wages, you're damn right profits are higher.
Here's one thing I do believe (here comes an opinion), the VIX is too low. Given all of the issues stated above ('good' and 'bad'), a VIX near multi-year lows seems unreasonable. There is a lot of uncertainty and the VIX reads as if there isn't. I think the VIX is wrong. I think the market, one way or the other,will move more than the VIX implies. But ya know what, I too could be wrong... seriously, I could be.
Hopefully, that summary was helpful as we move out of summer and into the fall. The facts will matter, regardless if it's an up or down day and regardless of what "data" sells advertising.
This is trade analysis, not a recommendation.
Follow @OphirGottlieb
Tweet
Legal Stuff:
Options involve risk. Prior to buying or selling an option, an investor must receive a copy of Characteristics and Risks of Standardized Options. Investors need a broker to trade options, and must meet suitability requirements.
The information contained on this site is provided for general informational purposes, as a convenience to the readers. The materials are not a substitute for obtaining professional advice from a qualified person, firm or corporation. Consult the appropriate professional advisor for more complete and current information. I am not engaged in rendering any legal or professional services by placing these general informational materials on this website.
I specifically disclaim any liability, whether based in contract, tort, strict liability or otherwise, for any direct, indirect, incidental, consequential, or special damages arising out of or in any way connected with access to or use of the site, even if I have been advised of the possibility of such damages, including liability in connection with mistakes or omissions in, or delays in transmission of, information to or from the user, interruptions in telecommunications connections to the site or viruses.
I make no representations or warranties about the accuracy or completeness of the information contained on this website. Any links provided to other server sites are offered as a matter of convenience and in no way are meant to imply that I endorse, sponsor, promote or am affiliated with the owners of or participants in those sites, or endorse any information contained on those sites, unless expressly stated.
Friday, August 23, 2013
Microsoft (MSFT) - CEO Steps Down; Stock Pops & Volatility Drops... But Someone Knew Ahead of Time. And So Did You.
MSFT is trading $34.40, up 6.2% with IV30™ down 13.1%. The LIVEVOL® Pro Summary is below.
Microsoft Corporation is engaged in developing, licensing and supporting a range of software products and services. The Company also designs and sells hardware, and delivers online advertising to the customers.
The option market priced in this event a week ago. And it appears there was some suspicious trading on 8-7-2013 (many thanks to Doris Frankel for pointing out the order flow). How about that?...
What I see here is evidence of potential improprietous usage of insider information and a fascinating reflection of this risk embedded inside the option market at large. And yes, there may have been rumors about this news, but someone speculated fairly largely to the upside on a stock that had just collapsed off of earnings for just a "rumor."
This is a follow up to the blog I posted on 8-20-2013 (i.e. three days ago). You can read that post by clicking on the title below:
Microsoft (MSFT) - Volatility Explodes, Stock Stays Still After Big Drop on Earnings; This is Not Equilibrium
As the title reads, my main contention three days was simply that the option market reflected extreme volatility in the near-term and that the stock, though it was trading in a tight range after the earnings fallout, was not at equilibrium. It turns out that the contention was correct -- MSFT was not at equilibrium, the stock did move big in the immediate-term and the volatility has now cooled off. The news "seemed" like a surprise, but not to the careful observer. Here's a news snippet:
---
The announcement of Microsoft (MSFT) CEO Steve Ballmer’s plans to retire within the next 12 months was just seconds old when shares of the famed software maker took off, up 8% in pre-market trading merely on investor glee that the king was (almost) dead.
In regular early trading, Microsoft shares were up 7% in to $34.68. Since Ballmer owns some 333 million shares, news of his retirement actually boosted his own net worth by about $1 billion.
Source: The Exchange via Yahoo! Finance; Ballmer’s Pending Departure Only Makes His Mistakes More Obvious
---
For the sake of ease, let's look at the two company summaries from 8-19 and today (8-23) side-by-side, below:
8-19-2013
8-23-2013
We see the stock is up ~10% and the volatility is down ~15% from three days ago.
If we look at the Options Tab from the close on 8-7-2013, below, we can see that 62,500 Sep 32 calls and 83,200 Sep 33 calls traded on that day, and they were substantially purchases. As we'll see later in this post, the OI in the Sep 33 calls is now 166,000+ while the OI in the Sep 32 calls is just under 80,000. The Sep 33 calls were purchased for ~ $0.20 and mid-day today were priced at ~ $2.00. That would be ~ 1000% in two weeks.
Let's examine this a little closer and turn to the Charts Tab (one-year) below. The top portion is the stock price, the bottom is the vol (IV30™ - red vs HV20™ - blue vs HV180™ - pink).
On the stock side we can first see the gap down on 7-19-2013 off of the earnings release from the day earlier (AMC). But then, as I've highlighted, the stock found a quite period where it literally moved ~$0.35 close-to-close in ~a month time period. Just stuck. But not the volatility...
Let's turn to the one IV30™ chart in isolation below.
To quote my prior article:
---
We can see that even though earnings were quite disappointing, the vol dropped (as it normally does) after earnings. The news was digested, the equity value dipped and all seemed back to normal. But after the implied dipped to 17.4% on 8-2-103, it has since exploded up more than 52%, breaching an annual high on Friday.
---
Exactly, Ophir, the volatility exploded as the stock was sitting in a quiet period. We can see that the level reached in the short-term implied was in fact an annual high... And what do you know, one week later, after a month of a frozen equity price, the stock has popped 6% and, note this, the volatility has dropped. The vol drop reflects that whatever risk was lingering in the stock is now gone -- or in English, the risk was this announcement, and it's now happened. Remarkable efficiency from the option market. Remarkably good timing in the August 7th call purchases too.
Finally, let's turn to the Options Tab, below.
Across the top we can see that Sep vol is priced to 22.84% and Oct vol is priced 22.10%, both down substantially on the news today. As I mentioned at the top, check out that OI in the Sep 32 and Sep 33 calls. How fortunate for someone...
Well there you go. MSFT was not in equilibrium, but the option market now reads that it is... at least for the short-term...
This is trade analysis, not a recommendation.
Follow @OphirGottlieb
Tweet
Legal Stuff:
Options involve risk. Prior to buying or selling an option, an investor must receive a copy of Characteristics and Risks of Standardized Options. Investors need a broker to trade options, and must meet suitability requirements.
The information contained on this site is provided for general informational purposes, as a convenience to the readers. The materials are not a substitute for obtaining professional advice from a qualified person, firm or corporation. Consult the appropriate professional advisor for more complete and current information. I am not engaged in rendering any legal or professional services by placing these general informational materials on this website.
I specifically disclaim any liability, whether based in contract, tort, strict liability or otherwise, for any direct, indirect, incidental, consequential, or special damages arising out of or in any way connected with access to or use of the site, even if I have been advised of the possibility of such damages, including liability in connection with mistakes or omissions in, or delays in transmission of, information to or from the user, interruptions in telecommunications connections to the site or viruses.
I make no representations or warranties about the accuracy or completeness of the information contained on this website. Any links provided to other server sites are offered as a matter of convenience and in no way are meant to imply that I endorse, sponsor, promote or am affiliated with the owners of or participants in those sites, or endorse any information contained on those sites, unless expressly stated.
Wednesday, August 21, 2013
Incyte (INCY) - Bio-Pharma Stock Explodes to 13-year High and Volatility Pops on Cancer Trial Results
INCY is trading $34.87, up 29.2% with IV30™ popping up 15.2%. The LIVEVOL® Pro Summary is below.
-------------------------------------------------------
Livevol Execution: Complex Trading Simplified
Click to Learn More
-------------------------------------------------------
Incyte Corporation (Incyte) is a biopharmaceutical company focused on the discovery, development and commercialization of small molecule drugs to treat serious unmet medical needs.
The news today that’s moving stock and volatility are results from a phase-two trial showing one of their compounds increased survival rates for pancreatic cancer significantly above the placebo. That is news indeed. This both an order flow and vol note.
I found INCY using the high option volume (relative to average) scan – it’s the single most active issue relative to its own average. I have included the Stats Tab snapshot. We can see that the company has already traded over 13,500 contracts traded on a total daily average volume of just 631. Calls have traded on a nearly 2:1 ratio to puts which is actually below the average of 2.8:1.
Let’s turn to the Charts Tab (two-year) below. The top portion is the stock price; the bottom is the vol (IV30™ - red vs HV20™ - blue vs HV180™ - pink).
On the stock side we can see the price is well into multi-year high territory. In fact, according to an article by IBD, this is a 13-year high in stock price. Just extraordinary…
But here’s the thing… It is extraordinary. So what is volatility doing? I have included the two-year IV30™ chart in isolation, below.
So the implied has popped today b/c of the news… OK, that makes sense. But what doesn’t make a lot of sense to me is why the volatility is “only” up this much. If we look over the last two-years we can see that the implied hit nearly 140% at one point, and even in the last ear it has been as high as 72.29%. So my question is, why is vol at 62%. Yes the news is out, but it wasn’t expected as far as the option market reflects. Volatility is up on the day, not down. So this looks like a surprise, and if it is, 62% vol??? Hmmm…
Finally, let’s look to the Options Tab.
Across the top we can see not only is Sep vol priced to 63.51%, but Oct and Dec decrease monotonically. In fact, for all expiries out to Jan’15 the volatility decreases monotonically. You mean to tell me that this is a ~49% vol stock in Mar of next year? OK… I would definitely put this one on a watch list. In any case, aside from stock prices and option volatility, let’s hope this drug is in fact all it seems to be and even more. While prevention of illness is the first choice, a treatment (or cure) is needed if prevention falls short.
Follow Live Trades and Order Flow on Twitter: @Livevol_Pro
This is trade analysis, not a recommendation.
Legal Stuff:
http://www.livevolpro.com/help/disclaimer_legal.html
Tuesday, August 20, 2013
Microsoft (MSFT) - Volatility Explodes, Stock Stays Still After Big Drop on Earnings; This is Not Equilibrium
MSFT closed Monday at trading $31.39, down 1.3% with IV30™ down 1.1%. The LIVEVOL® Pro Summary is below.
-------------------------------------------------------
Livevol Execution: Complex Trading Simplified
Click to Learn More
-------------------------------------------------------
Microsoft Corporation is engaged in developing, licensing and supporting a range of software products and services. The Company also designs and sells hardware, and delivers online advertising to the customers.
This is an elevated vol note oddly in a huge firm that released earnings, saw a large drop, found an equilibrium and now all of a sudden sees higher volatility than it did pre-earnings. Let's start with the one-year Charts Tab, below. The top portion is the stock price, the bottom is the vol (IV30™ - red vs HV20™ - blue vs HV180™ - pink).
On the stock side we can see two phenomena pretty clearly:
(1) Y-O-Y MSFT has risen from $30.74 to now $31.39 - so essentially no move at all.
(2) The last earnings release (the blue "E" icon represents earnings) was not good news. Here's a quick snippet from that release on 7-18-2013:
---
NEW YORK (AP) -- Microsoft stock took a big hit on Friday, after the software giant behind Windows, the Xbox and Surface tablets reported disappointing results for the latest quarter.
The results, which fell below Wall Street's expectations, included a large write-off for Microsoft Corp.'s Surface RT business. A poor reception for Windows 8 contributed to a revenue drop in the company's operating system software unit.
Microsoft "struggled far more than we had expected," said Cowen & Co. analyst Gregg Moskowitz, who downgraded the company's stock to "Neutral" from "Buy," and cut his price target to $33 from $38,
The analyst said in a note to investors that he is "much less confident" that the company can deliver healthy growth in the near future due to the magnitude of the Windows decline, the challenges for Surface, pressure on profit margins and the company's reorganization plans.
Source: AP via Yahoo! Finance, Microsoft shares tumble after weak 4th-qtr results
---
Like I wrote, not good news... but this is a vol note, so let's turn to the one-year IV30™ chart below in isolation.
I've circled both the level of the implied right on earnings (~21%) and the level today. We can see that even though earnings were quite disappointing, the vol dropped (as it normally does) after earnings. The news was digested, the equity value dipped and all seemed back to normal. But after the implied dipped to
17.4% on 8-2-103, it has since exploded up more than 52%, breaching an annual high on Friday. Oddly, the stock has stayed still as it closed at $31.40 the day after earnings and is literally $0.01 lower on Monday's close. So... we have ripping volatility and no stock movement at all.
Finally, let's turn to the Options Tab.
Across the top we can see that Sep vol is priced to 26.53% while Oct is priced to 24.61% and Nov is priced to 25.40%. So for all of those expiries, we're seeing quite elevated levels. So the question is, what's going on with Microsoft? Whatever the answer, the volatility seems to be reflecting the reality that MSFT stock price is not in equilibrium, regardless of the non-existent move since the earnings drop.
Follow Live Trades and Order Flow on Twitter: @Livevol_Pro
This is trade analysis, not a recommendation.
Legal Stuff:
http://www.livevolpro.com/help/disclaimer_legal.html
Subscribe to:
Posts (Atom)