Monday, September 27, 2010

Hertz (HTZ) - Elevated Vol with Earnings Calendar Could be a Trade

HTZ is trading $11.21 with IV30™ up 10.9%. The LIVEVOL™ Pro Summary is below.


I mentioned this stock a few times in the last month. You can read the prior posts here:

UPDATE: Hertz (HTZ) - Jan Call Interest, Spiking Vol, Stock Near Annual Low
Hertz (HTZ) - Risk Reversal Trades in Jan on Stock Yearly Low

Today I see a possible trade given the exploding vol in Oct and earnings in Nov. It appears on the elevated vol scan.

Custom Scan Details
Stock Price >=5
IV30™ - HV20™ >= 10
HV180™ - IV30™ <= -8
Average Option Volume >= 1,200
Industry != Bio-tech
Days After Earnings >= 10 <= 60

The goal with this scan is to identify short-term implied vol (IV30™) that is elevated both to the recent stock movement (HV20™) and the long term trend in stock movement (HV180™). I'm also looking for a reasonable amount of liquidity in the options (thus the minimum average option volume), want to avoid bio-techs (and their crazy vol) and make sure I'm not selling elevated IV30™ simply because earnings are approaching.

Let's look to the Skew Tab (click to enlarge).


We can see that Oct (red) is well above Nov (yellow). The last earnings cycle for HTZ was 8-3-2010. Since Oct expo is 10-15-2010, it's a reasonable bet that earnings will be after Oct. and in Nov. Hmmm...

The last earnings cycle had HTZ front month ATM straddle vol at 76 on it's peak right before earnings. The Livevol Pro Earnings & Dividends Tab, an isolated snap, is included (click to enlarge). Red is the front month vol, blue the back.


Let's turn to the Charts tab, now, 6 month vol chart (click to enlarge). The top portion is the stock price, the bottom is the vol (IV30™ - red vs HV20™ - blue vs HV180™ - pink). The yellow shaded area at the very bottom is the IV30™ vs. the HV20™ vol difference.


We can clearly see where I've highlighted the IV30™ explosion today. As of this writing, IV30™ is 65 against HV20™ of 51 and HV180™ of 54. In other words, short term implied is substantially above short term realized and long term realized. This feels like a vol sale... But...

Let's finally turn to the Options Tab (click to enlarge).


Note the vol difference between Oct and Nov. While Oct IV is 71, Nov IV is just 61. That's a 10 point vol diff while earnings (a vol event) are likely in Nov.

Possible Trades to Analyze
1. Sell the elevated Oct vol in the Oct 11 straddle @ $1.35 or 71 vol. Buy the depressed Nov 11 straddle for $2.15 or 62 vol for a net debit of $0.80 while gaining the benefit of the earnings vol. If HTZ sits here, and Nov vol goes from 62 to 76 (last earnings IV level), this could be a nice vol scalp selling out right before earnings.

2. Other possibilities are naked selling of Oct, "hoping" for steady stock behavior, then rolling that premium win into a purchase of Nov if it's still depressed and talking an earnings vol ride (or just take the premium win). Given the takeover happy world right now, I am more hesitant than I've been for a long time to be naked any upside. An Oct 11 straddle with a 12 strike call purchase could be wise if not doing the entire time spread.

Keep in mind, calendar spreads lose to takeovers if you're long the back (vega).

This is trade analysis, not a recommendation.

Legal Stuff:
http://www.livevolpro.com/help/disclaimer_legal.html

RINO (RINO) - Elevated Vol Trading Opportunity

RINO is trading $13.64, up 5.0% with IV30™ down 1.7%. The LIVEVOL™ Pro Summary is below.


I found this company using a custom scan for elevated vol from Livevol Pro™. The details are below.

Elevated Vol Scan Details
Custom Scan Details
Stock Price >=5
IV30™ - HV20™ >= 10
HV180™ - IV30™ <= -8 Average Option Volume >= 1,200
Industry != Bio-tech
Days After Earnings >=10 and <= 60


Let's look at the Charts Tab (6 months) to visualize the result (click to enlarge). The top portion is the stock price, the bottom is the vol (IV30™ - red vs HV20™ - blue vs HV180™ - pink). The yellow shaded area at the very bottom is the IV30™ vs. the HV20™ vol difference.


We can see the short-term realized is 45, long term-realized is 69 and the IV30™ is ~79. Next let's turn to the Options Tab and see if we can analyze a trade.


Possible Trades to Analyze
Selling the Oct 13/14 strangle @ $1.15 sells 68 vol (ish). This makes money is RINO is in ($11.85, $15.15) at Oct expo. Alternatives include selling the 13 or 14 straddle. Keep in mind, selling the 13 straddle is slightly bearish, and selling the 14 straddle is slightly bullish. Covering any of these sales with the Oct 15 calls is a relatively cheap insurance to the upside (~59 vol).

This is trade analysis, not a recommendation.

Legal Stuff:
http://www.livevolpro.com/help/disclaimer_legal.html

Saturday, September 25, 2010

Blackstone (BX) - Call Buyers Come in Huge for Third Time

On Friday, BX closed at $11.50 up 6.8%. The LIVEVOL™ Pro Summary is below.


On 9-3-2010, I noticed some very large call purchases in the Jan'12 15 calls in BX. You can read that original blog here:
Blackstone (BX) - Call Buyers Doubling Down

On 9-3-2010, I noted that: "The company has traded over 30,000 options on total daily average option volume of just 6,099. The largest trade was a 16,200 lot for $0.86 in the Jan'12 15 calls (purchases)."

On Friday I saw more of the exact same trade, but even bigger. The company traded over 46,000 options on total daily average option volume of just 6,766 with calls trading on a 53:1 ratio to puts. The actions was in the Jan'12 15 calls were over 36,000 traded (mostly purchases). One print alone was over 30,000, paying $1.05. The Stats Tab and Day's biggest trades snapshots are included (click either image to enlarge).


The Options Tab (click to enlarge) illustrates that the calls have a substantive OI from the 9-3-2010 trading and before that, from the 7-22-2010 trading. Both of those prior days were purchases, and I believe Friday was more of the same.


We can see that the Jan'12 vol is nearly 48, well above all the other months, specifically above: Oct (39), Nov (42) and even Mar'11 (43).

The Skew Tab snap (click to enlarge) illustrates the vols by strike by month.


We can see two things:
1) The skew in Jan'12 has not changed shapes to a dramatic upward bend.
2) The Jan'12 vol is well above the other months (as noted).

On 9-3-2010, the skew did show a slight kink to the upside in those calls, but I believe it was short lived. For completeness, I've included that chart as well.


Finally, the Charts Tab (6 months) is below (click to enlarge). The top portion is the stock price, the bottom is the vol (IV360™ - yellow vs HV360™ - pink). The yellow shaded area at the very bottom is the IV30™ vs. the HV20™ vol difference.


Just like on 9-3-2010, we can still see that the historical (54) is actually above the implied (47) going out to 360 days. On 9-3-2010 the values were 57 and 49 for HV360™ and IV™ respectively. Since the first post, BX is up from $10.35 to $11.50 or ~10%.

This is trade analysis, not a recommendation.

Legal Stuff:
http://www.livevolpro.com/help/disclaimer_legal.html

Friday, September 24, 2010

Transocean (RIG) - Buying Depressed 60-day Vol

RIG is trading $59.98, up 0.9% with IV30™ down 2.7%. The LIVEVOL™ Pro Summary is below.


I found this company using a custom real-time scan on Livevol Pro™ searching for low vol 60 days out.

Custom Scan Details
Stock Price >= $10
IV60™ >= 1
Industry != Bio-tech
Average Option Volume >= 1000
IV60™ - HV60™ <= -8 >= -40

Let's take a look at the Charts Tab (click to enlarge). The vol chart only: (IV60™ - yellow vs HV60™ - blue vs HV180™ - pink). The yellow shaded area at the very bottom is the IV30™ vs. the HV20™ vol difference.


We can see IV60™ is 39, while HV60™ and HV180™ are 53. In English, the 60-day implied vol is cheaper than the stock as moved over the last 60 trading days and the last 180 trading days.

The last earnings cycle for RIG was 8-4-2010. The next is 11-3-2010. That means the Nov options not only have low vol, but they have an embedded volatility event (earnings). Let's look to the Options Tab (click to enlarge).


Possible Trades to Analyze
1) Buying the Nov vol naked - Purchase the Nov 60 straddlefor $7.20 or 38 vol is one approach, though risky.

2) Buy the Nov ATM straddle but sell the Nov 52.5/70 strangle @ $1.75 for a total debit of $5.45. That sells 44 vol in the OTM puts and 34 vol in the OTM calls.

3) A little more tricky is to sell the Oct 52.5 puts to reduce the debit by $0.25. Then, assuming the stock isn't below $52.5, you could do trade #2.

4) Finally, risky but more interesting could be to do #3, but sell 2 of the Oct puts and of the Nov puts after. Or selling the Nov 50 put with the Nov 52.5.

This is trade analysis, not a recommendation.

Legal Stuff:
http://www.livevolpro.com/help/disclaimer_legal.html

Mead Johnson (MJN) - Scalping Vol on Earnings Date Bet

MJN is trading $57.33, up 2.4% with IV30™ up 9.7%. The LIVEVOL™ Pro Summary is below.


I found this company using the high vol real-time custom scan I created.  You can read about the details here: High Vol Custom Scannning and Trades.

Let's look at the Charts Tab. The top portion is the stock price, the bottom is the vol (IV30™ - red vs HV20™ - blue vs HV180™ - pink). The yellow shaded area at the very bottom is the IV30™ vs. the HV20™ vol difference.


We can see that IV30™ (36) is well elevated to HV20™ (22) and HV180™ (27). Or, in English, the 30 day implied is elevated to the realized movement of the stock over the last 20 trading days and the longer term realized movement of the stock over the last 180 trading days.

Another interesting complication here is earnings. The last earnings cycle was 7-29-2010. We're projecting earnings after the Oct expiration (10-15-2010). More on that in a sec...

The Skew Tab snap (click to enlarge) illustrates the vols by strike by month.


The shape of skew isn't the focus, but rather that the 55/60 strikes are actually higher vol in Oct than Nov. If Nov has earnings, that seems like a potential opportunity to trade. Let's look to the Options Tab (click to enlarge)


Possible Trades to Analyze
1) Straight Vol Sale: To bet that the vol is too high and that earnings are after Oct expo. an Oct 55/60 strangle sale @ ~ $2.00 on ~36 vol is a reasonable bet. This trade bets that the implied really is elevated and makes money at expo if MJN stock is in ($53, $62).

2) A bit less risky is selling that strangle in Oct and buying the strangle in Nov for a net debit of ~$2.25. This bets that MJN back month vol elevates to earnings and the stock stays put before then. Selling the Nov. strangle before earnings hoping for a nice scalp is a reasonable approach as well.

This is trade analysis, not a recommendation.

Legal Stuff:
http://www.livevolpro.com/help/disclaimer_legal.html

Thursday, September 23, 2010

* UPDATE: SunPower (SPWRA) - Cheap Vol Was a Purchase

* UPDATE

SPWRA is trading $14.01, up 11% with IV30™ up 6.8%. The LIVEVOL™ Pro Summary is below.


On 9-20-2010 I posted an article on SPWRA, noting the low vol relative to short term and long term historical. I made use of a custom scan in Livevol Pro and illustrated how to re-create it.  You can read that blog here:
SunPower (SPWRA) - Low Vol and Uneven Skew May be Purchase

The stock was trading $12.39 at the time. I noted:
"We can see the IV30™ is 51 while HV20™ and HV180™ are 62. In other words, the short term and long term realized volatility in the stock has been more than 10 points higher than the current implied. This stock was recently upgraded by two sell side firms giving it a nice little pop at the end of August and shooting the HV20™ up."

As of today the stock has moved and vol has risen, making the straddle a winner to both phenomenon. The Options Tab is included (click to enlarge).


If you made this trade, nice... The 13 straddle is worth ~$1.63 today and was worth $1.37 three days ago, or a 19% win since Monday.

Selling the upside might be a good idea covered to the long straddle, or closing the position entirely to take the win also makes sense.

This is trade analysis, not a recommendation.

Legal Stuff:
http://www.livevolpro.com/help/disclaimer_legal.html

CA - Feb and Jan'12 Call Buyers Continue Bullish Tech Order Flow

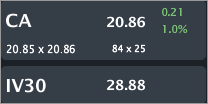
CA is trading $20.86, up 1.0% today. The LIVEVOL™ Pro Summary is below.


The company has traded over 14,900 options in the first three hours on total daily average option volume of just 1,583. All but 458 contracts have been calls yielding a 31:1 call:put ratio. The action however has been in the Feb'11 and Jan'12 calls - so longer term trades. The Stats Tab and Day's biggest trades snapshots are included (click either image to enlarge).


The Options Tab (click to enlarge) illustrates that the Feb'11 calls mostly opening (compare OI to trade size). The Jan'12 25 calls are ambiguous at first blush b/c OI >> volume today.


On 9-14-2010 the OI jumped in those calls from ~ 1,000 to over 14,000. The Level II pop-out is included (click to enlarge).


Going to the day before (9-13-2010) and hunting down those calls we can easily see that the interest opened long. The Time & Sales Tab snap is included below.


So the calls went up for $1.15 on ~$1.00 x $1.15 markets. These were purchases. The Skew Tab snap (click to enlarge) illustrates the vols by strike by month.


I've only included Feb'11 and Jan'12. Really the point here is that the skew has not reacted at all, even given the rather large growing OI in the Jan'12 options.

Finally, the Charts Tab (6 months) is below (click to enlarge). The top portion is the stock price, the bottom is the vol (IV30™ - red vs HV20™ - blue vs HV180™ - pink).


The Feb'11 options traded on 30 vol, the Jan'12 options on 31 vol. Note that IV30™, HV180™ and HV20™ are all below that. This feels like an expensive vol purchase. One note, HV360™ is actually 32, so the vol purchases aren't somehow "wacky" high. This flow feels like the rest of the tech sector, basically, up....

This is trade analysis, not a recommendation.

Legal Stuff:
http://www.livevolpro.com/help/disclaimer_legal.html

Radware (RDWR) - A Cheater and a Trade Going Forward

RDWR is trading $35.69, up 0.9% with IV30™ down 1.0%. The LIVEVOL™ Pro Summary is below.


I first mentioned this stock on 9-14-2010. You can read the post here:
Radware (RDWR) - Stock Explodes Mid-day on Rumors; Someone Knew...


It turns out an Israeli newspaper posted a rumor of $43 takeover price, the it took about half an hour to get translated into English. So no foul play, best I can tell on that day.

But...

I have some trade analysis in this post, but just to stoke the flame of a possible cheater, check this out. On 8-19-2010 (nearly a month before the "rumor" announcement), someone tried to purchase thousands of the Mar 35 calls for $0.55 against an NBBO of $0.10 x $0.50. This is against a stock price of ~$23.00 and at the time, a 52 wk high of ~$24. I have included the trades from that day. The call buyer was only filled on ~1,500 calls (click to enlarge). Note volume traded in one trade was larger than the entire daily average at the time.


You can see the jump in OI in those calls (click to enlarge).


As of today, those calls are worth ~$5.00, the OI is 1,750, so there you go. That's 10x the money in one month. Bottom line, I do feel like this was a cheater, but it's just one opinion of many.

On to the reality of today... The stock hasn't had any confirming news, and now there may be a trading opportunity, albeit risky.

First, let's look to the Charts Tab. The top portion is the stock price, the bottom is the vol (IV30™ - red vs HV20™ - blue vs HV180™ - pink).


I've highlighted the gap up - point being, this thing can move a lot and is in the midst of "waiting."

There is built up anticipation in the options in Oct; i.e. either this thing gaps up or gaps down, but $35 doesn't seem real stable for the long term. The Oct IV is over 82, while Nov IV is just 64. The Skew Tab snap illustrates this phenomenon perfectly (click to enlarge).


We see a fairly flat skew, actually surprisingly not upward bending. The shape of the skew is less of interest though, it's the absolute vol difference between Oct and Nov I'm eyeing.


Possible Trades
1) Sell the Oct 35 straddle @ $5.75 buy the Nov 35 straddle for $7.40. That's a net debit of $1.65.

The risk to this trade is that the stock moves far away from the 35 strike, essentially forcing the max loss of the full $1.65. A takeover or a confirmed "no-takeover" can easily move this stock price far from $35.

2) Sell the Oct 30/40 strangle @ $2.10, buy the Nov 35 straddle for $7.40. That's a net debit of $5.30.

If the stock moves exactly $5 away from the 35 strike in Oct, this becomes a big winner. If it moves far away from even the short strangle (<< $30 or >>$40), then it's max loss becomes just $0.30. A massive vol decline with the stock staying at $35 (like a confirmed takeover for $35) yields the max loss of $5.30, which is considerable.

These are actually quite risky trades, please note.

This is trade analysis, not a recommendation.

Legal Stuff:
http://www.livevolpro.com/help/disclaimer_legal.html

Wednesday, September 22, 2010

LM Ericsson (ERIC) - Straddle Seller

ERIC is trading $10.89. The LIVEVOL™ Pro Summary is below.


I got color on this from Mike Bristow, Vtrader Group head broker.

The company has traded over 10,000 options on total daily average option volume of just 1,168. The largest trade was 5,000 Jan'11 10 straddle sales (10,000 contracts). The Stats Tab and Day's biggest trades snapshots are included (click either image to enlarge).


The Options Tab (click to enlarge) illustrates that both sides are at least partially opening (compare OI to trade size). The existing interest is ambiguous, but I think it's actually long. We'll see tomorrow if OI goes up or down.


The Skew Tab snap (click to enlarge) illustrates the vols by strike by month.


The skew hasn't shifted due to the order flow which makes me feel a touch more confident that the existing interest was long.

Finally, the Charts Tab (6 months) is below (click to enlarge). The top portion is the stock price, the bottom is the vol (IV120™ - green vs HV120™ - purple vs HV180™ - pink).


The HV120™ is 43 while the IV120™ is 38. The straddle sold exactly 38 vol to my calculations. I definitely don't feel like this is expensive vol. Not sure what to say about the trade, I'm not in love with it maybe is the least eloquent yet descriptive way to give my opinion.

Generally I'm seeing a fair amount of vol selling in the Jan'11 options, feels like people are buying this rally and if that's the case all of the vols will look "low" relative to historical, but it doesn't mean they aren't sales.

The 52 wk range for ERIC is [$8.94, $12.39]. The straddle sale @ $1.95 requires that the stock be in ($8.05, $11.95) at Jan'11 expo.

This is trade analysis, not a recommendation.

Legal Stuff:
http://www.livevolpro.com/help/disclaimer_legal.html

ArvinMeritor (ARM) - Strangle Sale in Nov on Earnings Cycle

ARM is trading $14.93 with IV30™ up 0.9%. The LIVEVOL™ Pro Summary is below.


The company has traded over 12,000 options in the first three hours on total daily average option volume of just 1,964. The largest trade has been 5,000 Nov 14/15 strangle sales (10,000 contracts) @ $2.00. The Stats Tab and Day's biggest trades snapshots are included (click either image to enlarge).


The Options Tab (click to enlarge) illustrates that the calls and puts are mostly opening (compare OI to trade size). You can also see that Nov vol is elevated to Oct because of a potential earnings cycle (last cycle was 8-3-2010).


The Skew Tab snap (click to enlarge) illustrates the vols by strike by month.


We can see Nov elevated to Oct. Other than that, a pretty normal skew, though the 17 strike does show a relatively large divergence.

Finally, the Charts Tab (6 months) is below (click to enlarge). The top portion is the stock price, the bottom is the vol (IV60™ - yellow vs HV60™ - blue vs HV180™ - pink).


The strangle sold 53.5 vol on average. I see that IV60™ is 53, while HV180™ is 56 and HV60™ is 57.6. This vol sales feels cheap to me. Even odder to me, ARM does have a bit of a history of moving on earnings news more than the straddle was pricing.

The 52 wk range for ARM is [$6.80, $17.22]. The strangle sale on Nov expo wins if the stock is in ($12, $17) which is a pretty wide range. Basically, I'm not in love with this trade, but selling options usually makes me feel warm and fuzzy.

This is trade analysis, not a recommendation.

Legal Stuff:
http://www.livevolpro.com/help/disclaimer_legal.html